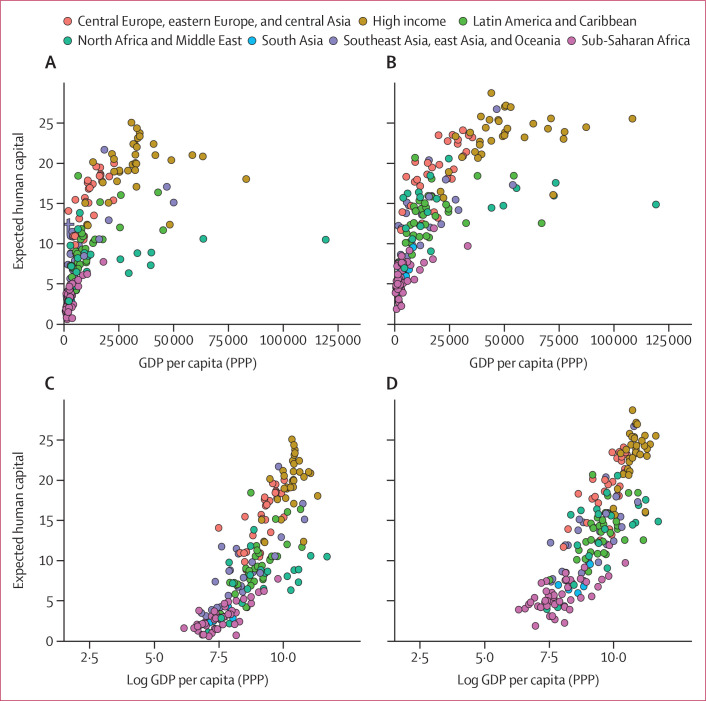
Figure 6.
Association between expected human capital and GDP per capita, 1990 and 2016
Countries categorised into regions according to the Global Burden of Disease super-regions. General movement to the right and upwards shows global economic, health, and education development between 1990 and 2016. Expected human capital and GDP per capita in 1990 (A) and 2016 (B). Expected human capital and GDP per capita in log space in 1990 (C) and 2016 (D). GDP per capita is measured in 2017 US$ at PPP. GDP=gross domestic product. PPP=purchasing power parity.

