Figure 8.

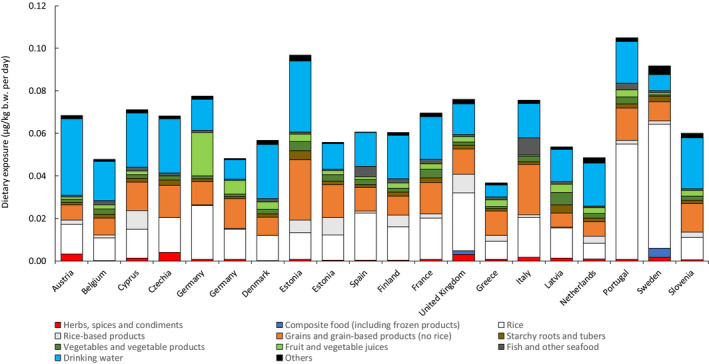
Average contribution of selected food groups to the mean dietary exposure to iAs (at the LB estimations) in the age class ‘Adolescents’ across different European countries

Average contribution of selected food groups to the mean dietary exposure to iAs (at the LB estimations) in the age class ‘Adolescents’ across different European countries