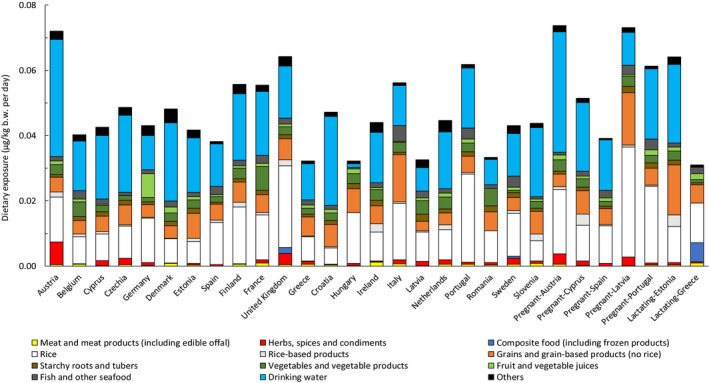
Figure 9.

Average contribution of selected food groups to the mean dietary exposure to iAs (at the LB estimations) in the age class ‘Adults’ and on specific population groups (‘Lactating women’ and ‘Pregnant women’) across different European countries
