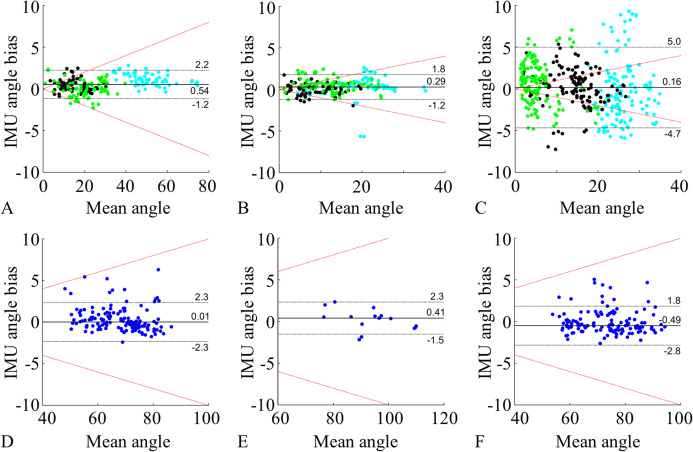
Figure 5. Bland–Altman plots.
Comparison of IMU to motion capture joint angles ROM for flexion (A), extension (B), lateral flexion (C), cervical rotation (D), cervical flexion/extension (E). Cervical rotation segment angles (F) were also added. A–C represent the lumbar segment (cyan), lower thoracic segment (black), and upper thoracic segment (green). (D) and (E) represent the cervical segment (blue). F represents the head sensor SK (blue). All the plots show: median bias (black line), limits of agreement (1.45 IQR, black dotted lines), and 10% error threshold (red dotted lines).

