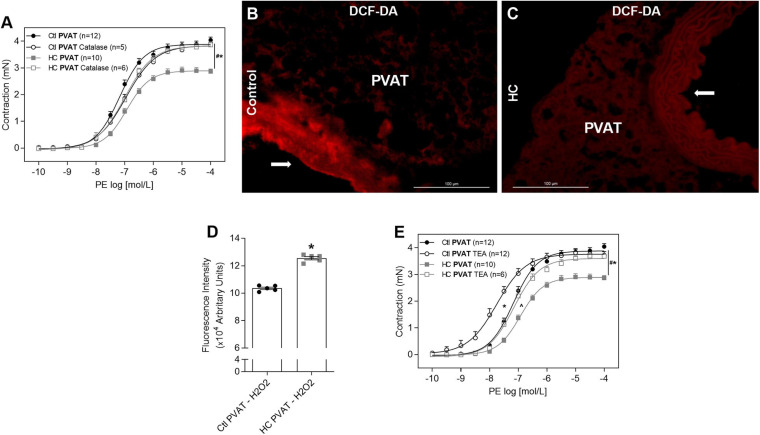
FIGURE 10.
Involvement of H2O2 and potassium channels in the effect of HC diet on PVAT control of vascular tone and evaluation of H2O2 availability. Cumulative concentration-response curves for PE in the presence of PVAT in aortas of control and HC groups previously incubated or not with (A) catalase or (E) TEA. Values represent mean ± SEM. The total number of animals required to carry out the experiments in each group (n) is presented in parentheses in the graphs. Statistical significance was determined using two-way ANOVA followed by Holm–Sidak’s post hoc test. *p < 0.05 vs. control PVAT; #p < 0.05 vs. HC PVAT; ∧p < 0.05 vs. control PVAT TEA represent the differences in the Emax and pD2 values. Representative sections of basal H2O2 levels in the PVAT of (B) control and (C) HC groups exposed to DCF-DA probe. Arrows indicate the location of the endothelial layer of blood vessels. Scale bars indicate 100 μm. (D) Quantification of H2O2 production in the PVAT was expressed as fluorescence intensity in graphical bars with mean ± SEM. The total number of animals required to carry out the experiments in each group (n) is presented in the dispersion points in the graphs. Statistical significance was determined using Student’s t-test. *p < 0.05 vs. control.

