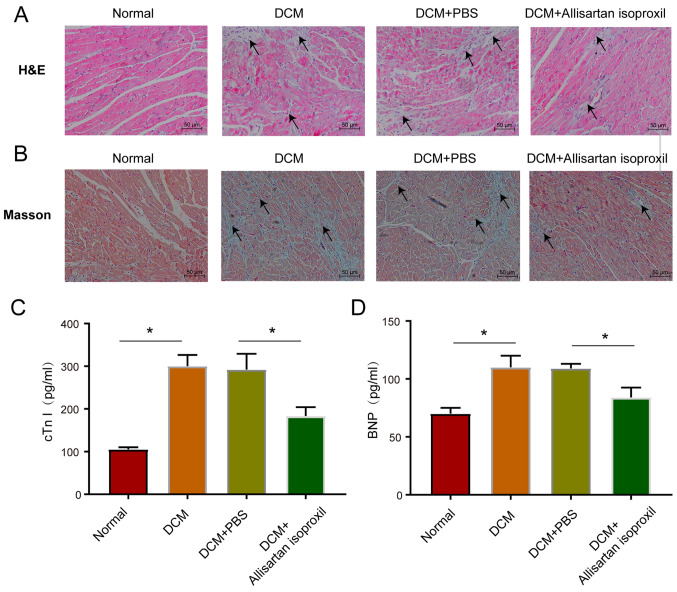
Figure 2.
Histological and cardiac marker analysis of DCM rats. (A and B) Staining of heart tissues harvested at the end of the treatment period. (A) Representative images of myocardial tissue sections stained with H&E; scale bar, 50 µm. Inflammatory cell infiltration and disorganized myocardial nuclei (arrowhead). (B) Assessment of cardiac fibrosis by Masson's trichrome staining; scale bar, 50 µm. The accumulation of collagen (arrowhead). (C) Serum levels of cTnI. (D) Serum levels of BNP. The values are the mean ± SD of n=6 in each group. *P<0.05. DCM, diabetic cardiomyopathy; cTnI, cardiac troponin I; BNP, B-type natriuretic peptide.

