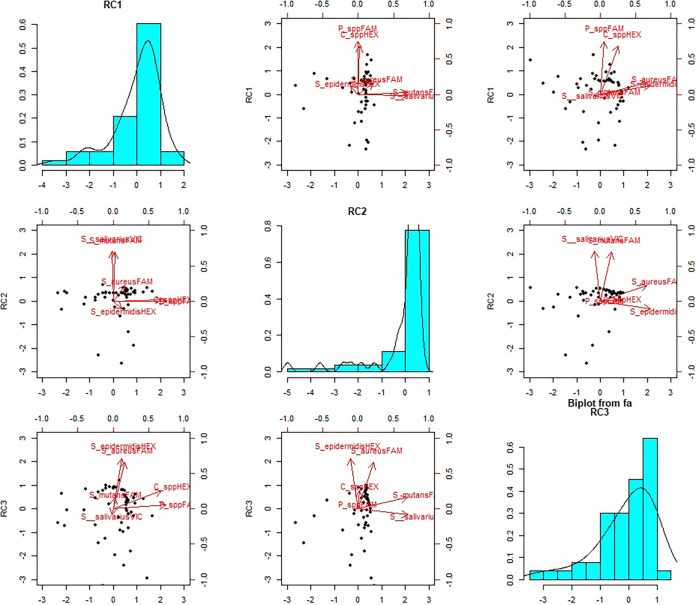
FIG 2.
Droplet component distribution. Principal-component analysis biplots showing component 1 versus component 2, component 1 versus component 3, and component 2 versus component 3. The first, second, and third components explain 28%, 27%, and 27% of the variability observed, respectively. The role of the bacterial indicators within the different components is summarized by vectors within the scatter graphs.

