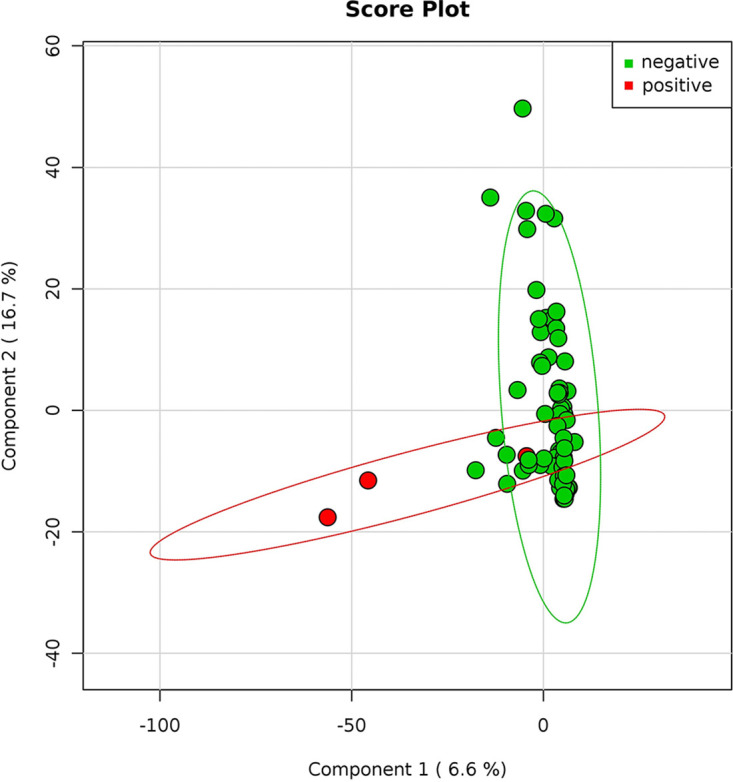
FIG 5.

SARS-CoV-2-positive and -negative samples. Principal-coordinate analysis of the normalized relative abundance of all samples divided by negative and positive results of SARS-COV2. Data are plotted at the genus-level classification. The variance is explained for 6.6% and 16.7%, respectively for components 1 and 2. SARS-CoV-2 positive (red) and negative (green) samples are indicated.
