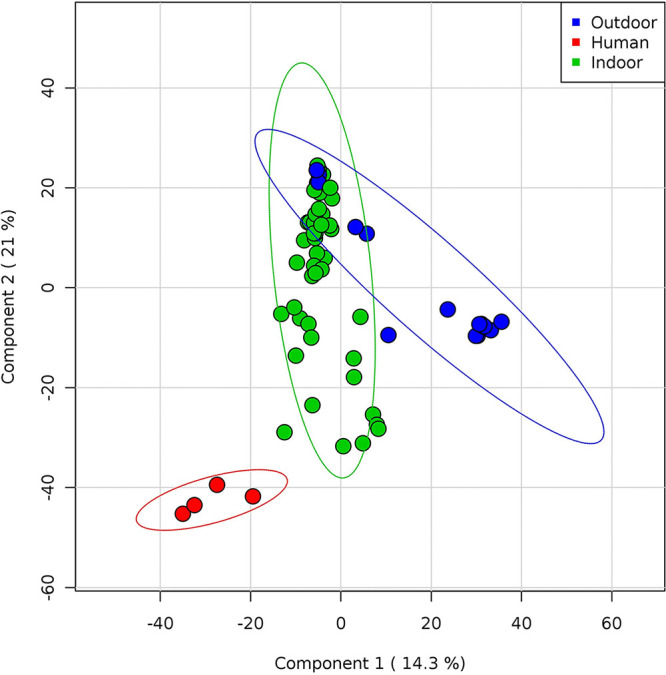
FIG 6.

Whole microflora analysis of indoor and outdoor samples. Partial least square-discriminant analysis (PLS-DA) shows Pearson distance between different samples using phylogeny distribution based on 16S rRNA genes. Samples are colored according to the sampling point (red, human droplets; green, indoor; blue, outdoor). Components 1 and 2 explain 14.3% and 21% of the variance, respectively. Outdoor samples overlapping indoor samples are characterized by fomites, whereas the blue sample between groups is the outdoor handle of a building main entrance. All samples without a major presence of environmental microflora but characterized by a prevalence of human microbiota from droplet biofluids tend to segregate independently.
