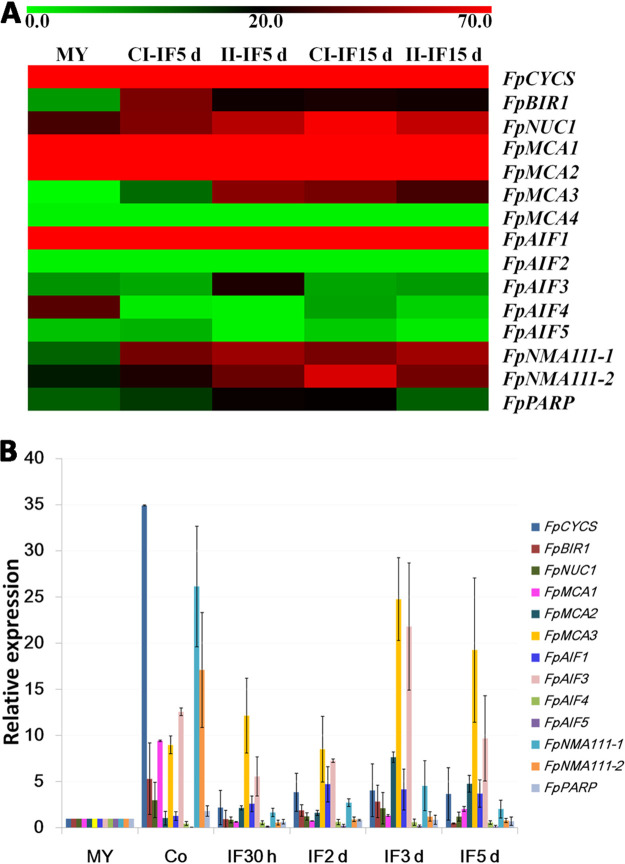
FIG 2.
Expression profiles of apoptosis-related genes in F. pseudograminearum. (A) Transcriptome heat map. The color bar represents the expression values, ranging from green (0) to red (70). MY, mycelia. CI-IF5 d and CI-IF15 d indicate samples from 5 and 15 days after infection of susceptible wheat Guomai301; II-IF5 d and II-IF15 d indicate samples from 5 and 15 days after infection of resistant wheat Zhoumai24. (B) qRT-PCR analysis. Fold changes in transcript levels of the apoptosis-related genes were calculated relative to the level at mycelia (MY). Co, conidia. IF30 h, 2 d, 3 d, and 5 d indicate samples from susceptible wheat cultivar Aikang58 at 30 hpi, 2 dpi, 3 dpi, and 5 dpi, respectively. The F. pseudograminearum TEF1 gene was used as a reference. Bars represent standard errors from three independent RNA isolations and qRT-PCR replicates.

