FIG 1.
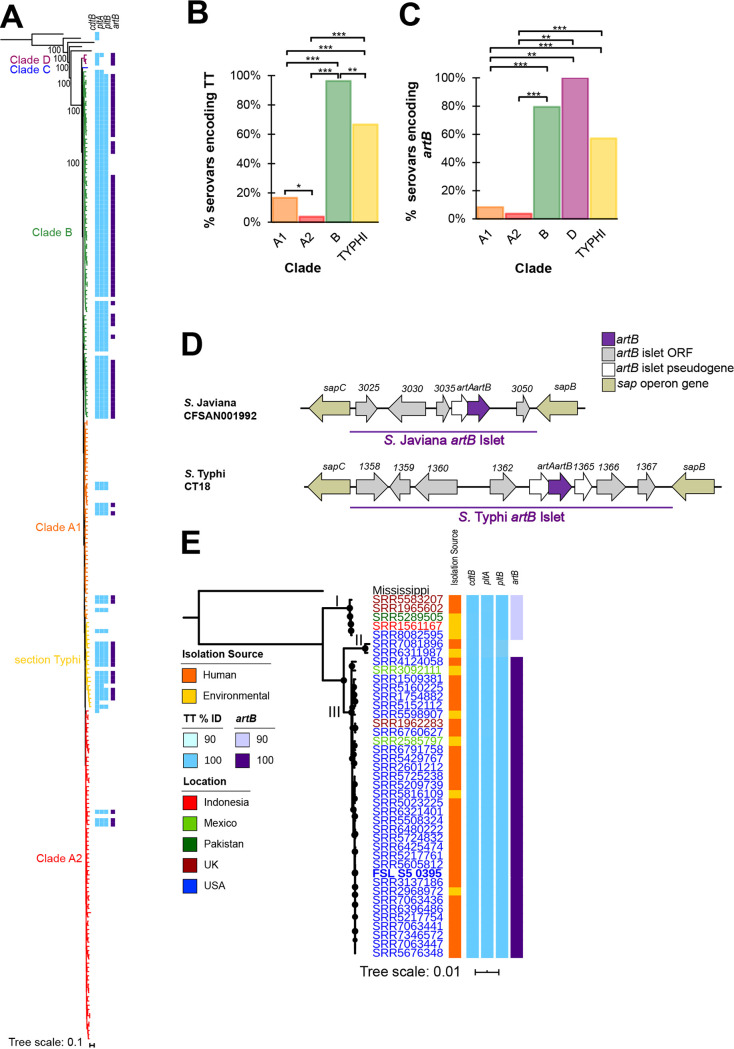
Serovars in some phylogenetic clades are significantly more likely to encode TT genes and artB. (A) Reconstruction of phylogeny of 235 S. enterica subsp. enterica serovars and five additional subspecies based on the comparison of 13,181 core SNPs. Maximum likelihood analysis was computed using a general time-reversible model with gamma distribution in RAxML (66). Bootstrap values for branchpoints between subspecies are shown (based on 100 bootstrap repetitions). Branches are colored to represent the clade of the isolate as reported previously (29) and the detection of TT genes (cdtB, pltA, and pltB; shown in light blue) and artB (shown in purple) among S. enterica isolates using 85% nucleotide identity and 90% query coverage as criteria for detection. S. enterica subsp. arizonae was used to root the phylogeny. Histograms summarizing the proportion of serovars in each clade for which all TT genes (cdtB, pltA, and pltB) (B) or artB (C) was detected with blastn (i.e., the additional 6 S. enterica subsp. enterica serovars having putative pltA and pltB were not included in this analysis); note that clade C is not shown because TT genes and artB were not detected in these serovars. *, P < 0.05; **, P < 0.001; ***, P <0.0001, FDR corrected for pairwise comparisons of Fisher’s exact tests. (D) Comparison of the artB-islet in S. Javiana CFSAN001992 and S. Typhi CT18; ORFs and genes are named according to annotations from NCBI. The artB islet is denoted by the purple horizontal bar. ORFs that are at least 100 nucleotides (nt) in length are shown in gray (those <100-nt long were classified as pseudogenes and are shown in white), while genes shown in gold represent sap operon genes that flank the artB islet; artB is shown in dark purple. Islets are not drawn to scale. (E) Maximum likelihood reconstruction of phylogeny based on 63,994 core SNPs among 41 S. Javiana isolates and a representative isolate of S. Mississippi (used to root the phylogeny). The S. Javiana strain (FSL S5-0395) used in phenotypic experiments is shown in bold. Circles at nodes represent bootstrap values >90 (based on output from 1,000 bootstrap repetitions). Assembly names are colored to reflect the country from which the isolate originated; the isolation sources (human clinical shown in orange, environmental shown in yellow) as well as the nucleotide identity of TT genes (light blue) and artB (purple) are shown as colored bars. Roman numerals are used to depict the clades of the S. Javiana isolates.

