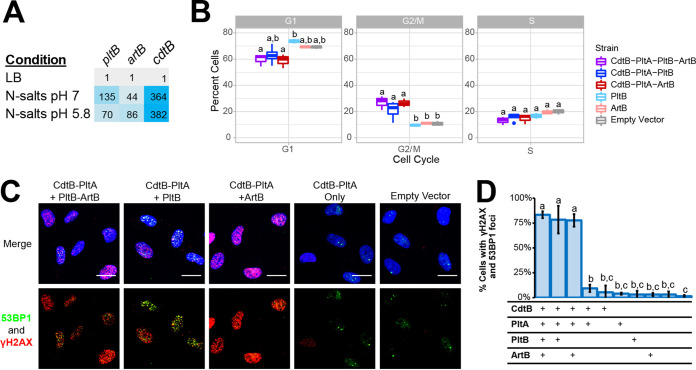
FIG 2.
ArtB or PltB can be used to form an active TT binding subunit. (A) Fold expression (2−ΔΔCT) of pltB, cdtB, and artB in S. Javiana cells grown for 5 h in either N-salts minimal medium at pH 7 or pH 5.8 (representing mid-exponential phase for this condition), normalized to expression of S. Javiana cells grown for 3 h in LB broth, pH 7 (representing mid-exponential phase for this condition). Results are averaged from three independent experiments; cells are shaded to represent high (blue) and low expression (gray) relative to expression in LB broth. (B) Cell cycle analyses of HIEC-6 cells coincubated with lysates of E. coli BTH101 cells expressing different combinations of tagged typhoid toxin subunits: CdtB-His, PltA-Strep, PltB-3×-Flag, and ArtB-c-Myc. HIEC-6 cells were coincubated with toxins for 24 h prior to analyzing DNA content with propidium iodide staining and analysis by flow cytometry. Data represent the averages from three independent experiments; boxplots that do not share lowercase letters are statistically different (Tukey’s adjusted P value < 0.05). (C) Assessment of DNA damage response activation among HIEC-6 cells treated with toxin subunits. Immunofluorescence staining of HIEC-6 cells coincubated for 24 h with total cell lysates containing different combinations of CdtB-His, PltA-Strep, PltB-3×-Flag, and ArtB-c-Myc. DNA damage response proteins are shown in green (53BP1) and red (γH2AX); nucleic acids were stained with DAPI (blue). Scale bars, 20 µm. (D) Quantification of HIEC-6 cell nuclei having ≥4 53BP1-foci as well as γH2AX foci; the table below the graph shows which subunits were present in the supernatant added to the HIEC-6 cells. Two negative controls were included and are represented by the final two bars in the graphic, which represent HIEC-6 cell populations that were treated with supernatants from E. coli BTH101 cells with an empty vector (left) and untreated cell populations (right). Lowercase letters indicate statistically significant differences in the proportions of cells having DDR foci; bars that share lowercase letters are not significantly different at α = 0.05 after correcting for multiple comparisons.

