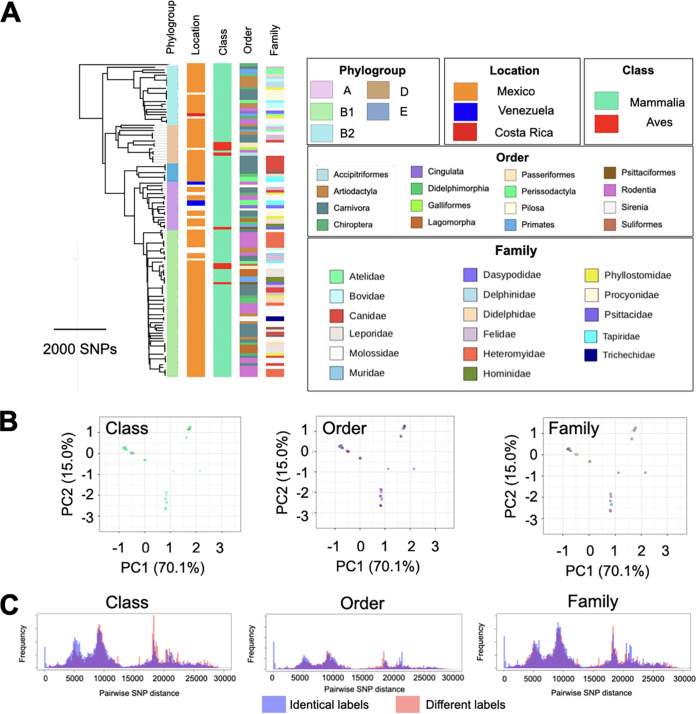
FIG 1.
Phylogenetic distribution of host specificity and cluster analysis. (A) Phylogenetic tree of our E. coli strains from wild-animal hosts and its association with host taxonomy, at different taxonomic levels. Families of host species colonized by only one E. coli strain in our collection are not shown. (B) Principal-component analysis of our E. coli strains, with labels representing the phylogroup of the E. coli isolate and the taxonomic rank of the host species. Each color corresponds to one taxonomic rank, shown in panel A. (C) Distribution of pairwise SNP distances for E. coli strains from hosts belonging to the same (red) and different (blue) taxonomic ranks.

