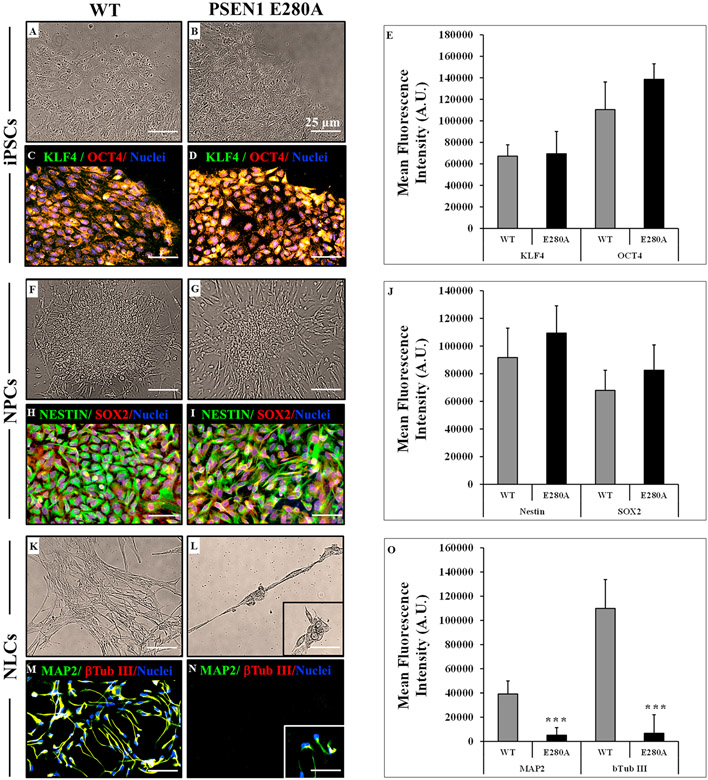
Fig. 3. The PSEN1 E28A NPCs-derived NLCs fail to complete neural differentiation.
(A) Representative light microscopy image of iPSCs colonies formed from a healthy individual; (B) Representative light microscopy image of iPSCs colonies formed from an AD patient carrying PSEN1 E280 A mutation; (C–D) Representative immunocytochemistry images of fibroblast-derived iPSC stained for KLF4 (green) and OCT (red) in WT and PSEN 1 E280 A mutation. Nuclei are stained with Hoechst (blue). Scale bars 25 μm; (E) Quantification of KLF4 and OCT in WT and PSEN 1 E280 A mutation; (F) Representative light microscopy image of NPCs from a healthy individual; (G) Representative light microscopy image of NPCs formed from an AD patient carrying PSEN1 E280 A mutation; (H-I) Representative immunocytochemistry images of iPSCs-derived NPCs stained for NESTIN (green) and SOX (red) in WT and PSEN 1 E280 A mutation. (J) Quantification of NESTIN and SOX in WT and PSEN 1 E280 A mutation; (K) Representative light microscopy image of NLCs from a healthy individual; (L) Representative light microscopy image of neural-like cells (NLCs) formed from an AD patient carrying PSEN1 E280 A mutation; (M-N) Representative immunocytochemistry images of NPCs-derived NLCs stained for MAP2 (green) and β Tub III (red) in WT and PSEN 1 E280 A mutation. (O) Quantification of MAP2 and β Tub III in WT and PSEN 1 E280 A mutation. Nuclei are stained with Hoechst (blue). Scale bars 25 μm. Data are expressed as mean ± S.D. *p < 0.05, **p < 0.005 and ***p < 0.001.

