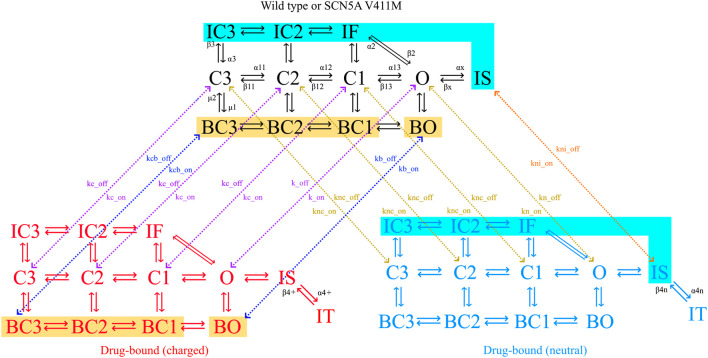
FIGURE 2.
Diagram of the sodium channel Markovian model. The channel can be in closed (C), inactivated (I) or open (O) states as indicated by their name. The model has fast (IF, IC2, IC3) and slow (IS) inactivation dynamics, as well as a bursting mode of operation (B). Flecainide (but not ranolazine) trapping dynamics are represented by the trapped state (IT). Transitions between states are indicated with solid arrows, together with their respective transition rates. Drug-free states are depicted in black (wild type or mutated), charged drug-bound channels in red and neutral drug-bound states in blue. Binding (on) and unbinding (off) rates (k) determine the transitions between models, shown with dotted arrows. Color-coded zones indicate channel states that are connected to each other, but their arrows have been omitted for clarity. Yellow zones highlight the bursting states where the charged drug the binds and unbinds, the transition rates being kbc_on and kc_on for the binding and kbc_off and kc_off for the unbinding. Cyan zones highlight the inactive states where the neutral drug the binds and unbinds, the transition rates being ki_on for the binding and ki_off for the unbinding.

