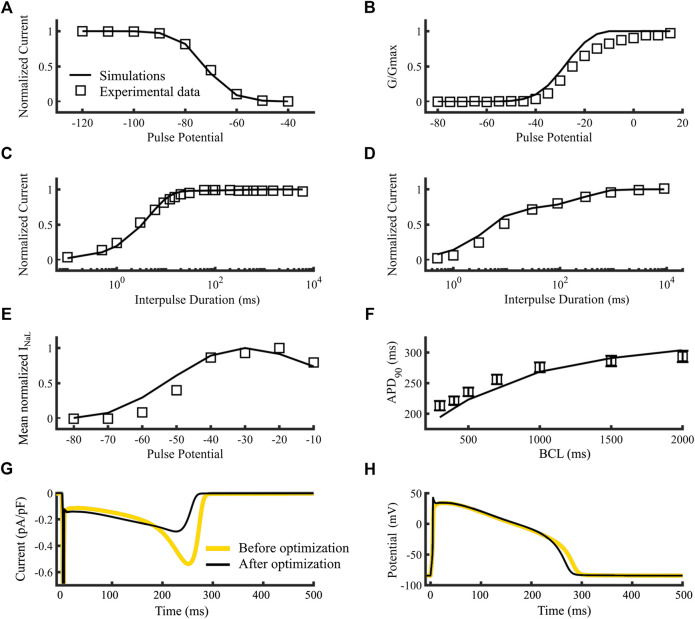
FIGURE 3.
Optimization of the control model of the sodium current dynamics. Squares are references and lines are simulations (A–F). (A) Steady-state availability. (B) Steady-state activation. (C) Recovery from inactivation. (D) Recovery from use-dependent block. (E) INaL current-voltage relationship. (F) APD90 Restitution curve of an isolated endocardial cell. (G) time course of the sodium current’s slow component of an isolated endocardial cell. (H) time course of the membrane potential of and isolated endocardial cell. Simulations using the original Moreno et al., 2013 model (yellow lines) and our new version (black lines) (G,H). Data are from Rivolta et al. (2001) and Liu et al. (2002) (A–D), O’Hara et al. (2011) (E) and Maltsev et al. (1998) (F).

