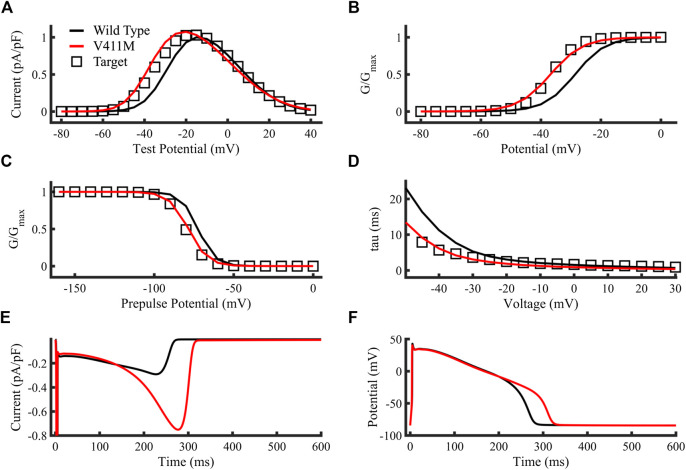
FIGURE 4.
Optimization of the SCN5A V411M mutation model. Targets were represented as open squares, simulations using our SCN5A V411M mutation model as red lines and simulations using our wild type model as black lines. (A) Current-voltage relationship. (B) Steady state activation. (C) Steady state inactivation. (D) Inactivation time constants. (E,F) Simulated isolated endocardial time course of the sodium current’s slow component and the action potential for wild type (black line) and for heterozygous SCN5A V411M mutated (red line) cells. APD90 prolongation caused by the heterozygous mutation was a result of an increase in INaL as observed in its time course in (E) and was calculated by comparing wild type and mutation action potential time courses in (F).

