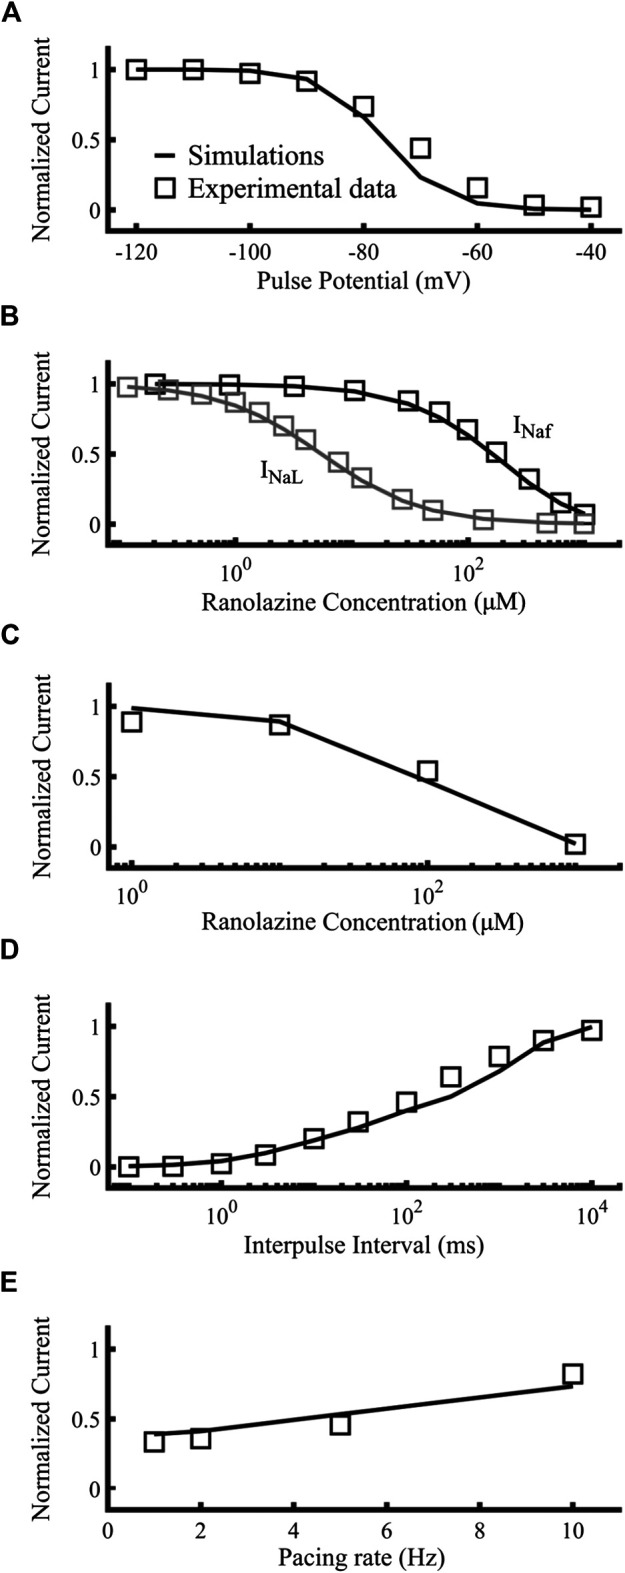
FIGURE 6.

Optimization of the ranolazine model. Targets were represented as open squares and simulations with our new ranolazine model as lines. (A) Steady state availability of 10 µM ranolazine. (B) Tonic block of fast and late components of the sodium current. (C) Use-dependent block. (D) Recovery from use-dependent block of 10 µM ranolazine. (E) Frequency-dependent recovery from use-dependent block of 100 µM ranolazine. Experimental data are from Moreno et al. (2013).
