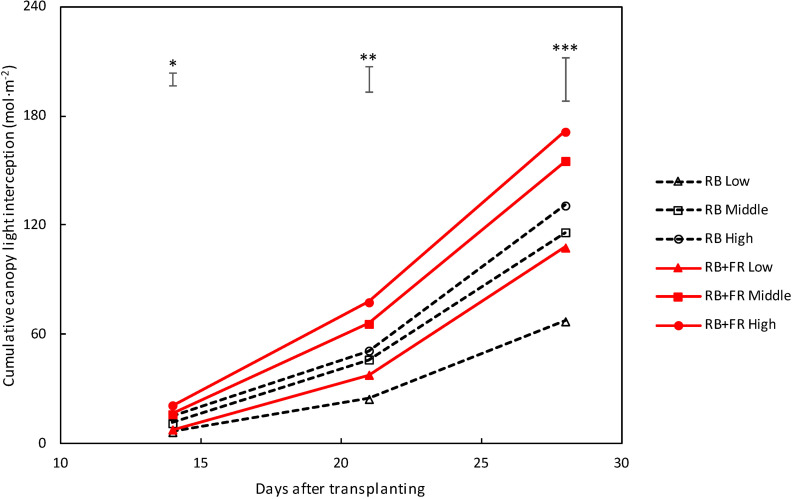
FIGURE 5.
Intercepted photosynthetic photon flux density (PPFD) of lettuce canopy grown at three planting densities (low, middle, and high being 23, 37, and 51 plants m–2). Solid lines represent with far-red radiation (FR) treatment (52 μmol m–2 s–1 FR) and dashed lines indicate treatment without FR. Light was cumulated from 14 to 28 DAT. Bars on top of each day represent least significant difference. Significant FR effect: ∗P < 0.10, ∗∗P < 0.05 and, ∗∗∗P < 0.01. Data are means of two blocks (n = 2) each with four–six replicate plants.

