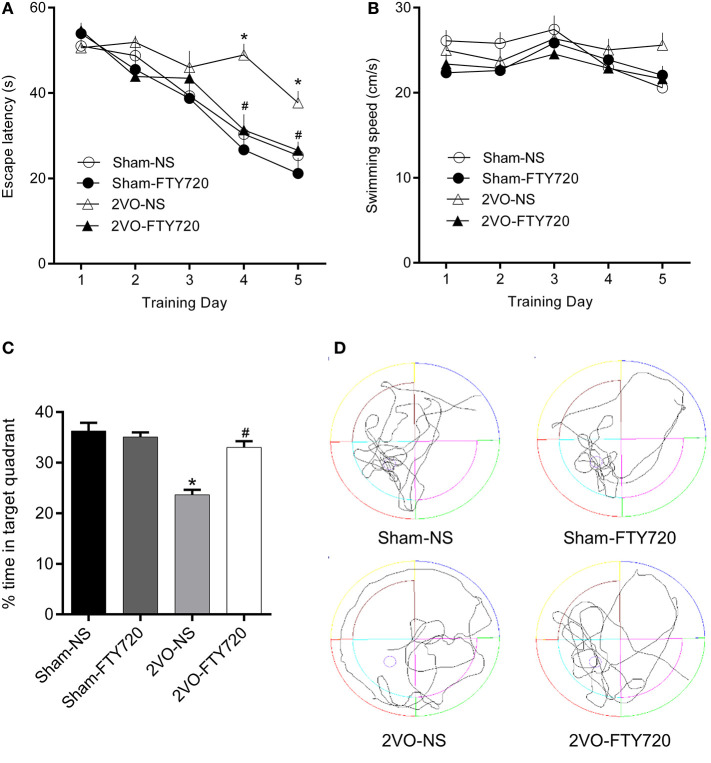
Figure 2.
The escape latency (A), swimming speed during the training phase, (B) percentage of time spent in target quadrant (C), and representative swimming paths (D) in the probe trial of MWM task of FTY720 or Saline treated rats after the 2VO surgery. All data are shown as mean ± S.E.M, n = 12–13 rats for each group. *compared to sham-NS rats, p < 0.05, #compared to 2VO-NS rats, p < 0.05.

