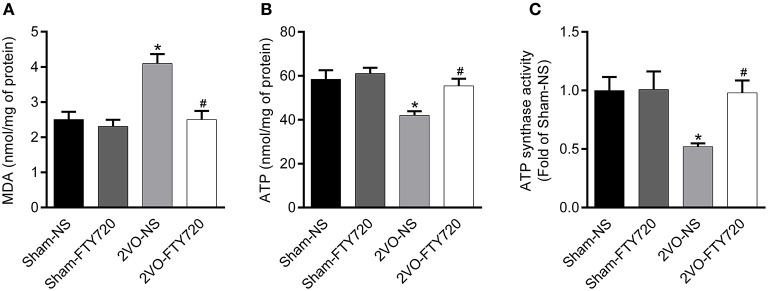
Figure 5.
Quantitation of MDA (A), ATP content (B) as well as ATP synthase activity (C) in the hippocampus of FTY720 or saline treated rats after the 2VO surgery. Data are shown as mean ± S.E.M. n = 4–5 rats for each group. *p < 0.05 compared with the sham-NS group. #p < 0.05 compared with the 2VO-NS group.

