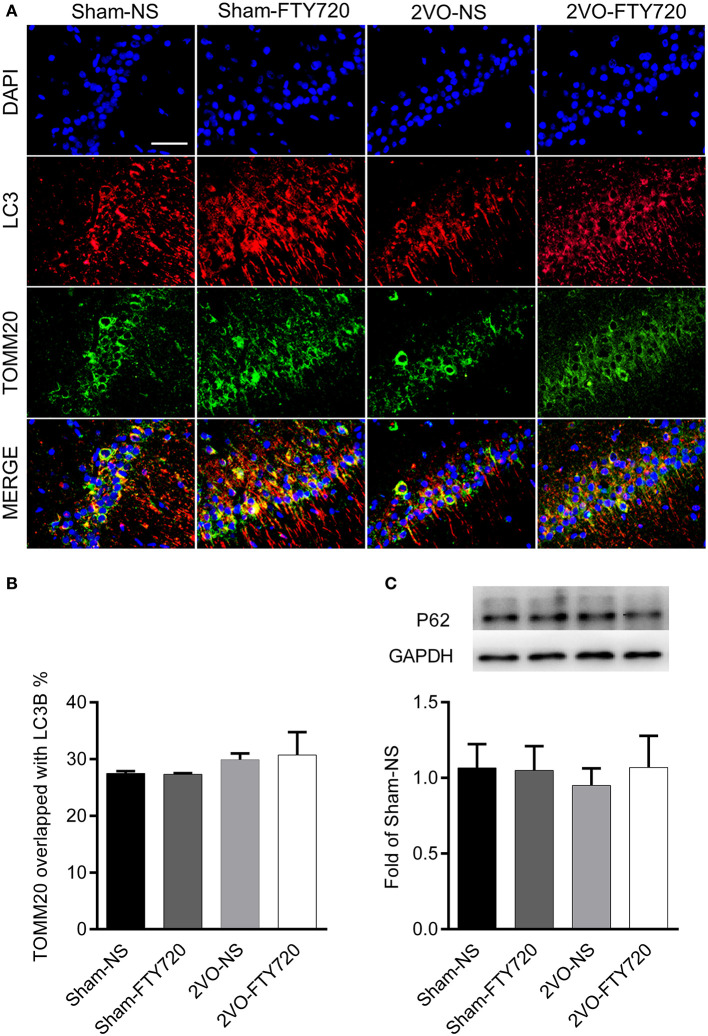
Figure 7.
The effect of FTY720 on hippocampal mitophagy markers of 2VO rats. (A) Representative immunofluorescent images of LC3 and TOMM20 colocalization in the hippocampus CA1 region. (B) The effect of FTY720 on hippocampal mitophagy markers of 2VO rats. (C) Representative hippocampal p62 immunoblot bands of FTY720 or saline treated rats after the 2VO surgery. p62 levels were normalized to GAPDH and expressed as fold of sham-NS in the lower panel. All data were shown as mean ± S.E.M. n = 4–5 rats for each group. Scale bar=50 μm, 400×.

