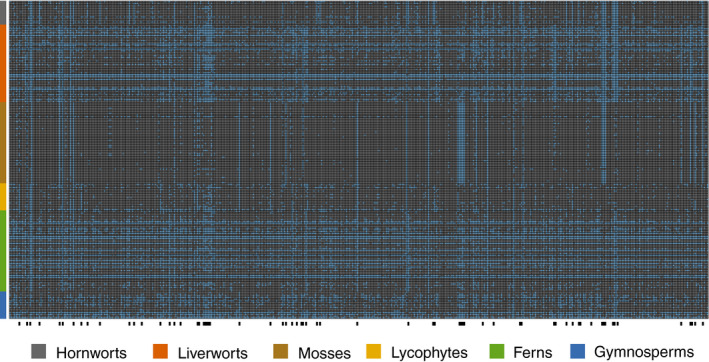
FIGURE 3.

Heat map showing the distribution of data in the flagellate plant samples across the 451 probe regions (i.e., exons). Loci that were missing for an individual are colored blue in the heatmap while sampled loci are grey. Black bars along the bottom of the heatmap indicate loci with biases among major plant groups, where less than 25% of one group had the locus and over 75% of another group had the locus.
