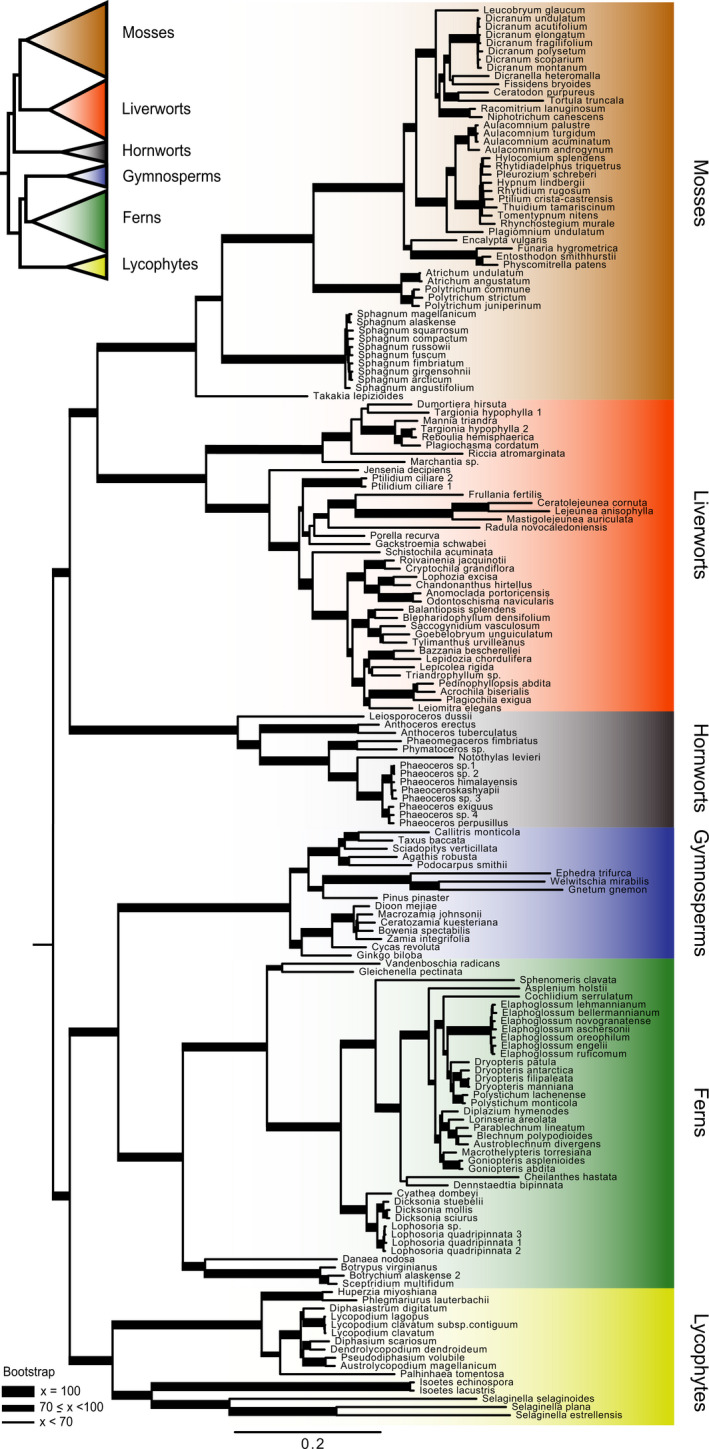
FIGURE 4.

Phylogram from a maximum likelihood analysis of the supermatrix made by concatenating the alignments from the GoFlag 451 probe regions (i.e., exons) for the samples with at least 45 loci. The tree was rooted between the bryophytes and vascular plants.
