. 2020 Dec 16;3(1):e190199. doi: 10.1148/ryai.2020190199

Figure 4:

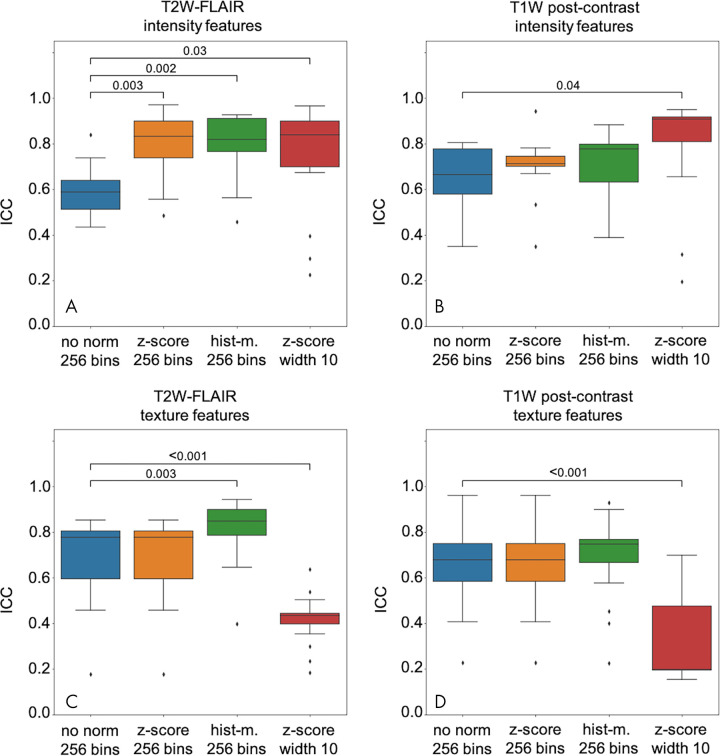
Distribution of intensity and texture intraclass correlation coefficient (ICC) values under different conditions. ICC for, A, B, intensity and, C, D, texture features extracted from T2-weighted fluid-attenuated inversion recovery (T2W FLAIR) (left) and T1-weighted (T1W) postcontrast (right) using either z score normalization (z-score) or histogram matching (hist-m.) compared with features extracted from not-normalized (no norm) images. Significant differences in the feature group mean ICC between feature extraction strategies (paired Wilcoxon test) are indicated with brackets.

Distribution of intensity and texture intraclass correlation coefficient (ICC) values under different conditions. ICC for, A, B, intensity and, C, D, texture features extracted from T2-weighted fluid-attenuated inversion recovery (T2W FLAIR) (left) and T1-weighted (T1W) postcontrast (right) using either z score normalization (z-score) or histogram matching (hist-m.) compared with features extracted from not-normalized (no norm) images. Significant differences in the feature group mean ICC between feature extraction strategies (paired Wilcoxon test) are indicated with brackets.