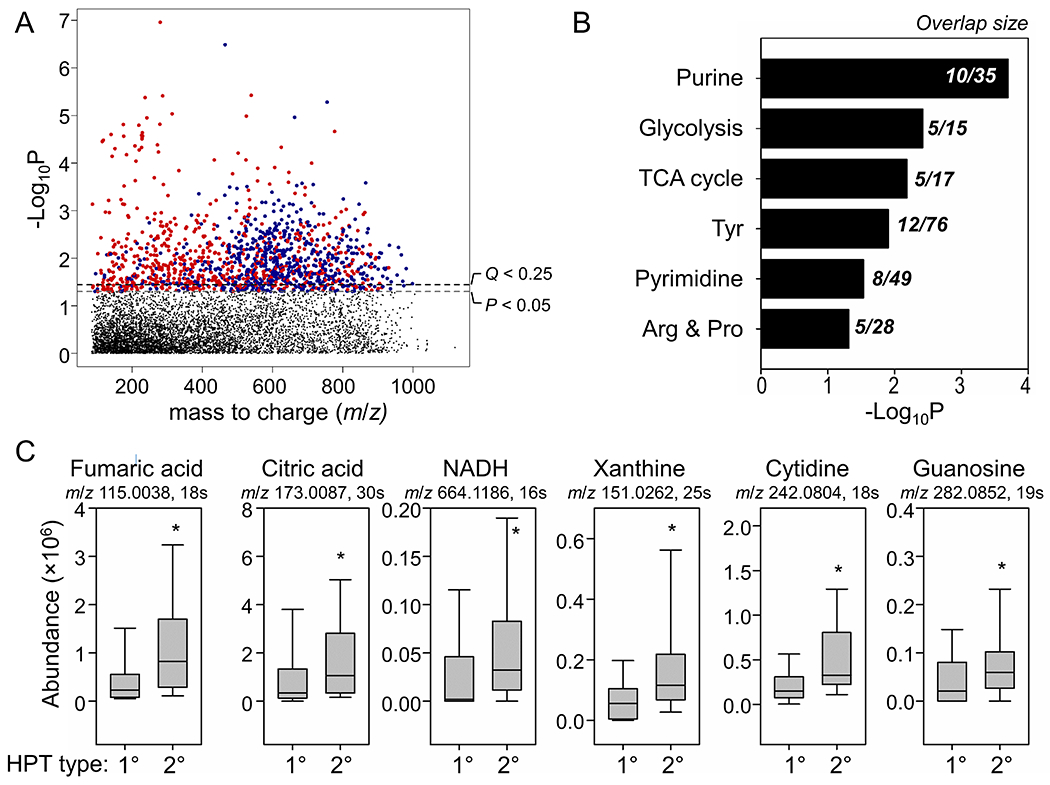
Figure 2.

Metabolic profiles that were different between primary and secondary parathyroid hyperplasia (1° vs 2° HPT). (A) Type I Manhattan plot for −log P vs m/z features with C18 chromatography separation and negative ESI mode. Red indicates positive correlation between significant features (P < 0.05) and DDT exposure and blue indicates negative correlation. (B) Metabolic pathways enriched by significant features (FDR Q < 0.25 and VIP > 2.0) that were different between 1° vs 2° HPT. The overlap size is the number of significant metabolites in each pathway. (C) Representative metabolite abundance from the TCA cycle and purine and pyrimidine metabolic pathways. * P < 0.05 between 1° vs 2° HPT.
