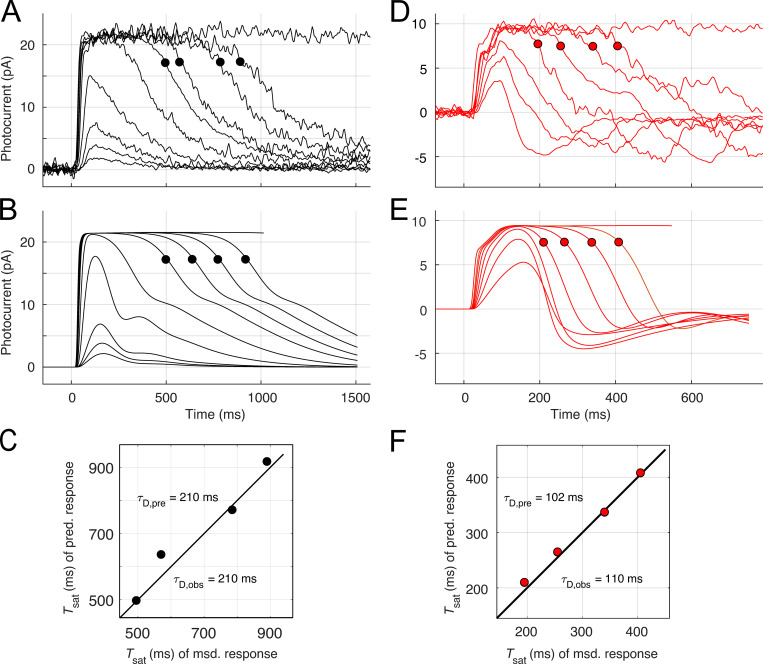
Figure 10.
Key features of the photocurrent responses of Kv2.1−/− rods can be explained with an extension of phototransduction theory to include the voltage dependence of CNG channels and the NCKX, and the voltage-dependent and voltage-activated conductances of the inner segment. Related to Fig. 1. (A) Response family of a WT rod: with the exception of that to the most intense, the traces were restricted to subsaturating responses and saturated responses that exhibit recovery translation invariance (Nikonov et al., 1998). The measured flash strengths were 4.6, 8.7, 18, 108, 427, 1,422, 2,774, 5,263, 10,570, and 73,000 photons μm−2. The filled symbols are plotted on the traces at the times (Tsat) when the dark currents had recovered 20% from saturation. (B) Predictions of the two-compartment model; filled symbols identify times 20% recovery from saturation, as in A. (C) Comparison of the times in saturation (Tsat) extracted from the empirical traces (msd.) and the predicted traces (pred.). The symbols τD, Obs and τD, pre give the values of the dominant time constants estimated by least-squares fitting of straight lines of Tsat versus the natural log of the flash strength for the observed and predicted traces, respectively (Nikonov et al., 1998). In the theoretical model, the lifetime τE of the Gtα-PDE (G*-E*) complex was assumed equal to τD, Obs (210 ms), and the lifetime of photoactivated rhodopsin (R*) was set to 45 ms (Eq. S9). Theory predicts the points to follow a line of unit slope (unbroken line). (D and E) Response family of a Kv2.1–/– rod and model predictions (the same rods whose response to the most intense flash were predicted and plotted in Fig. 7 on a much faster time scale); the circular symbols plot the times of 20% recovery from saturation (Tsat), as in A and B. The measured flash strengths were 108, 224, 427, 747, 1,423, 2,774, 5,263, and 73,000 photons μm −2. In the model calculations the lifetime τE of the Gtα-PDE (G*-E*) complex was assumed equal to τD, Obs (110 ms), while R* was assumed to deactivate with a time constant of 30 ms for subsaturating flashes, segueing to 70 ms for saturating flashes (Eq. S11). Most other parameters were set to the same value for WT and Kv2.1–/– rods (Table S2). (F) Comparison of the dominant time constants extracted from analysis of the empirically measured and theoretically predicted traces (the predicted responses to the most intense flashes in A and C are provided in Fig. 7; predicting the time course of the recoveries to this intensity flash, estimated to produce more than 75 R* per disc face, is beyond the scope of the model).

