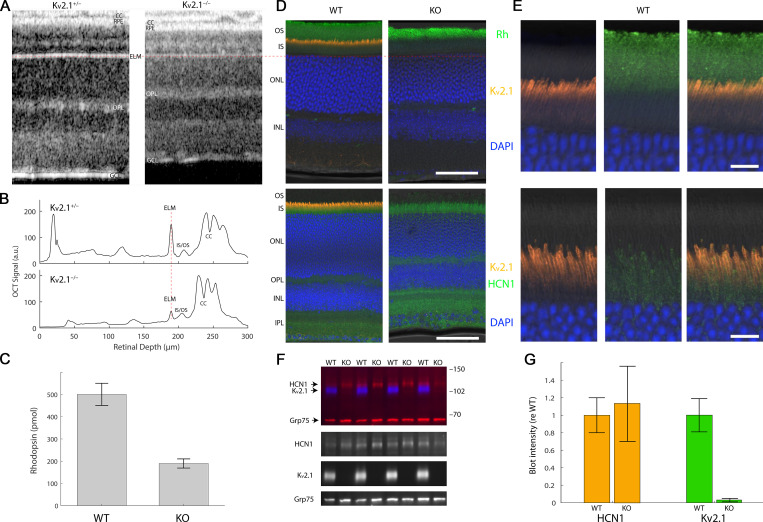
Figure 2.
OCT reveals thinning of photoreceptor layers of the Kv2.1−/− retina, and immunostaining distinctive patterns of Kv2.1 and HCN1 expression in the rod IS. (A) OCT B-scans of central retina of live heterozygous and Kv2.1−/− mice. CC, choriocapillaris; OPL, outer plexiform layer; GCL, ganglion cell fiber layer. The OCT B-scans have been aligned at the ELM; a red dashed line through the ELM is extended across the figure to the histochemical sections in D to show alignment of the two kinds of section. (B) Axial profile plots of the scattering intensity of the B-scans in A, aligned at the ELM (red dashed line) to help identify highly scattering retinal features. (C) Measurement of rhodopsin content of WT and Kv2.1−/− (KO) retinas (n = 5 retinas from three mice of each genotype). Error bars are SD. (D) Retinal sections stained for Kv2.1 and HCN1 reveal Kv2.1 expression to be narrowly confined to the apical inner segment compartment of photoreceptors (orange), while HCN1 resides more broadly in the basal inner segment as well as the synaptic layers (bottom, green). Scale bars, 20 µm. (E) Higher magnified views of representative sections of WT retina shown in D, with red, green, and merged channels separately shown to highlight the differences in Kv2.1 and HCN1 channel staining. Scale bars, 5 μm. (F) Representative immunoblot of homogenates of WT and Kv2.1−/− mice labeled with antibodies for Kv2.1 (blue) and HCN1 (red, upper band), with Grp75 served as loading control (red, lower band). Numbers at right indicate positions of molecular weight standards (kD). Individual regions/channels from the blot are also shown below in black and white. (G) Quantification of Kv2.1 and HCN1 protein levels by Western blot (mean ± SEM, n = 10 mice/group). Fluorescence intensities were background-subtracted, normalized by the loading control (Grp75), and expressed relative to WT. HCN1 expression was not statistically different between WT and KO samples (P > 0.05).

