Figure 4.
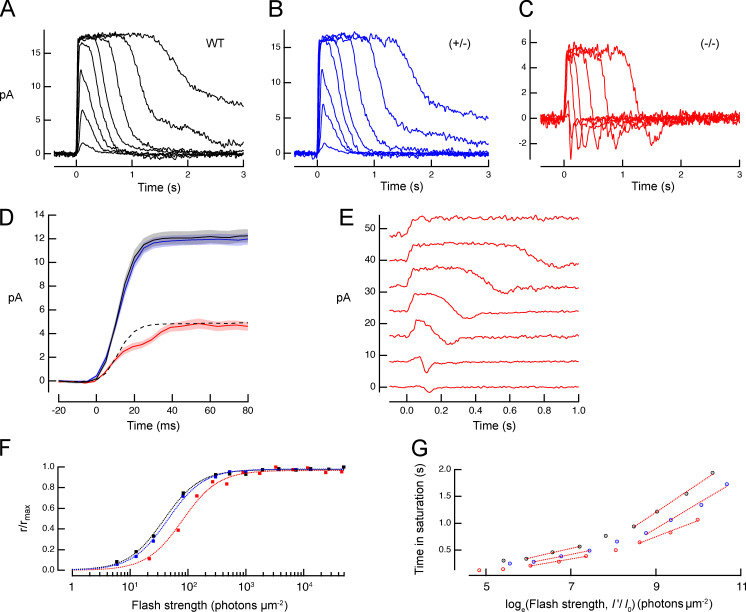
In the absence of Kv2.1 channels, rods generate a reduced photocurrent response whose rising phase has a shoulder, and whose recovery phase undershoots the dark-adapted baseline. (A–C) Families of photocurrent responses of a WT rod, a rod of a Kv2.1−/− mouse (−/−), and one from a heterozygote (+/−). Flash strengths ranged from 7 to 4,000 photons μm−2. (D) A comparison of averaged saturating photocurrent responses of WT and Kv2.1−/− rods; the dashed line presents the WT response scaled to the amplitude of the Kv2.1−/− response. (E) Selected responses from C separated and replotted on an expanded time scale (arbitrarily shifted vertically with the response to the dimmest flash at the bottom). (F) Response versus intensity relations extracted from the response families in A–C (traces for some strongly saturating responses are not shown in A–C). Data were fitted with exponential saturation functions, 1 − exp(−I/Io) with Io values of 108, 112, and 262 photons μm−2 for the WT, +/−, and −/− rod responses, respectively. (G) Pepperberg plot of time in saturation as a function of the logarithm of the flash strength. The abscissa values (I’) were scaled by the ratio of the Io value of each group to Io for the WT group. The slope of the lower component estimates the dominant recovery time constant for flashes producing less than ∼1 photoisomerization per disc face; see Table 2 for average values.

