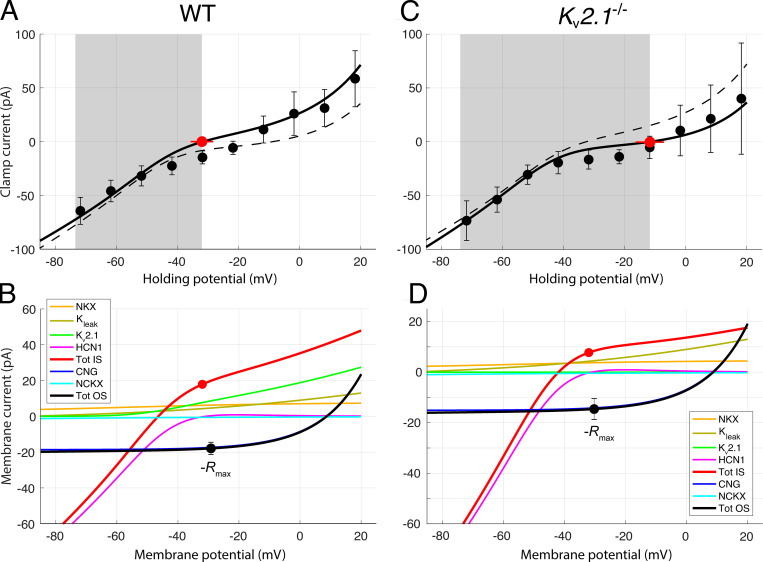
Figure 6.
Contributions of outer segment and inner segment ionic mechanisms to the voltage clamp currents of dark-adapted WT and Kv2.1−/− rods. (A and C) WC voltage clamp current as a function of holding potential for a population of dark-adapted WT (A; n = 5) and Kv2.1−/− (B; n = 5) mouse rods; error bars are 95% confidence intervals, and the shaded gray areas reflect the observed physiological range of membrane potentials measured from the WC recordings. Zero-current holding potentials (filled red symbols with lateral error bars; Table 2) were measured immediately upon WC access. The solid black curves are generated as the sum of the red and black curves in the respective lower panels. In A and C, the dashed curves present the I-V curve used to describe the data of the other genotype; thus, for example, the dashed curve in A replots the unbroken black curve in C. (B) Component analysis of the voltage clamp current of the dark-adapted WT rod. The two outer segment inward components are CNG current (dark blue) and NCKX current (cyan); their sum is given by the black curve; this curve was required to go through the filled black symbols, which plot the negative of the photocurrents (−Rmax, Table 3) measured at the effective outer segment holding potential; the error bars are 95% confidence intervals. The CNG current curve is the Boltzmann function of Eq. 3 with reversal potential VCNG = +8.5 mV and steepness factor sCNG = 14 mV (Baylor and Nunn, 1986). The NCKX current curve is given by Eq. 4, with VNCKX = −14 mV, sNCKX = 70 mV, KNCKX = 1,100 nM (Schnetkamp et al., 1991), and INCKX,sat(VNCKX) = −2.0 pA and −1.6 pA for WT and Kv2.1−/−, respectively (Lagnado and McNaughton, 1991). The inner segment components are the NKX electrogenic current (α3β2 isoform; Eq. 12; Supplemental text), Kv2.1 and HCN1 currents, and an unidentified K+ leak current; the sum of the inner segment components is given by the red curve. The Kv2.1 curve was generated with Eq. 10b with PK adjusted so that the current at Vm,rest is 9.1 pA, corresponding (with EK = −91 mV) to GKv2.1 = 0.18 nS (Eq. 10a). The leak current magnitude is assumed to be identical in both genotypes, and has the magnitude 2.7 pA at −32.0 mV. The HCN1 I-V curve was generated with Eq. 11 with GHCN1,rest = 1.45 nS and EHCN1 = −31 mV. The sum of the red and black curves in B is plotted as the black curve in A. The inner segment zero-current holding potential is plotted as a red circle at the average Vm, rest for WT rods (−32 mV). The filled black circle, which has the same magnitude, is plotted at the resting potential of the outer segment, which is situated slightly positively relative to the red symbol because the circulating current flows through the internal resistance of the rod (Fig. 1). At the WT resting potential, the currents are not only in electrical equilibrium but also produce homeostasis of the permeant ions Na+, K+, and Ca2+, based on the stoichiometry and other properties of the NCXK and NKX exchangers (see Theory). (D) Component analysis of the Kv2.1−/− rod dark current. The components are the same as those of the WT rod, but in the absence of Kv2.1 channels, an unidentified K+ leak current of 5.0 pA at the resting potential (−12 mV) of the inner segment is required for electrical balance. Extrapolated to Vm,rest of the WT rod, this current would have the amplitude 2.7 pA, which is equal to the magnitude of the leak current assigned to the WT rod at Vm,rest in B. For the HCN1 current, GHCN1,rest = 1.6 nS, and EHCN1 = −31 mV as in the WT rod. At the resting potential, the Kv2.1 current accounts for 80% of the total non-NKX, non-HCN1 outward current (the ordinate scale in D has been expanded relative to that in B to facilitate inspection of the component curves).

