Figure 8.
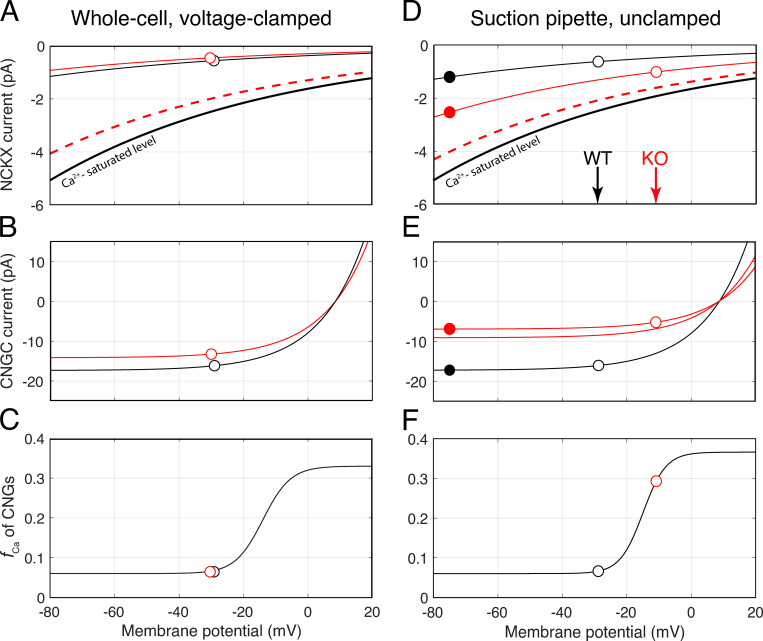
Voltage dependence of NCKX current, CNG channel current, and the fraction of CNG current carried by Ca2+ for voltage clamped and unclamped conditions. (A) Dependence of the NCKX current on membrane potential for the average WT and Kv2.1−/− (KO) rod under WC voltage-clamp to the WT resting potential, −32 mV. The black (WT) and red (KO) curves plot the I-V curve of the rod NCKX (Lagnado and McNaughton, 1990; Eq. 4) scaled to pass through the values (open circles) based on the assumption that the rods have the same normal resting Ca2+i, Cadark = 320 nM. The thicker black curve plots the calcium-saturated NCKX activity function of the WT rod, obtained by scaling the curve for the resting condition by (320 + Kex)/320, with Kex = 1,100 nM (Schnetkamp et al., 1991). The dashed red curve plots the calcium-saturated NCKX activity function of the Kv2.1−/− rod, adjusted for the shorter average length of its outer segment. (B) Dependence of the CNG channel current on membrane potential for WT and Kv2.1−/− rods (Eq. 3); the symbols plot the negative of the Rmax values in Table 3 (the lateral offset of the symbols arises from differential depolarization of the outer segments when the inner segment is clamped to the same potential; cf. Fig. 1). (C) Fraction of the CNG current carried by Ca2+ (the smooth curve is the same at that in F). (D) Dependence of NCKX current on membrane potential of average WT and Kv2.1−/− (KO) rod under unclamped conditions; open symbols plot the values at respective resting potentials, while filled symbols give measured values upon maximal hyper-polarization. (E) CNG channel current dependence on membrane potential; the filled symbols represent the saturated magnitude of recorded currents, while the open symbols represent the values projected along the curves to the unclamped resting potentials. For the WT rod, the saturated photocurrent (CNG + NCKX) is 20 pA; for the KO rod, 9.5 pA. The red curve not drawn through the points represents the CNG current that would have been recorded if the KO rod had the same length as the WT rod. Depolarization alone cannot fully account for the ratio of the KO to WT currents, so based on Eq. 3, an ∼12% reduction in resting cGMP level by elevated Ca2+i is implicated. (F) Dependence of fCa, the fraction of CNG current carried by Ca2+ on membrane potential. The values of fCa for the WT rod in darkness (open black symbol, fCa = 0.072) and the Kv2.1−/− rod (open red symbol, fCa = 0.29) are derived from the homeostasis relation (Eq. 5), given the respective curves in D and E. A “saturating Boltzmann” function (smooth black trace) was fitted through the data points to provide a continuous function fCa(Vm), needed for analysis of dynamic changes in Ca2+ fluxes during phototransduction as the outer segment membrane potential varies. CNGC, CNG channels.

