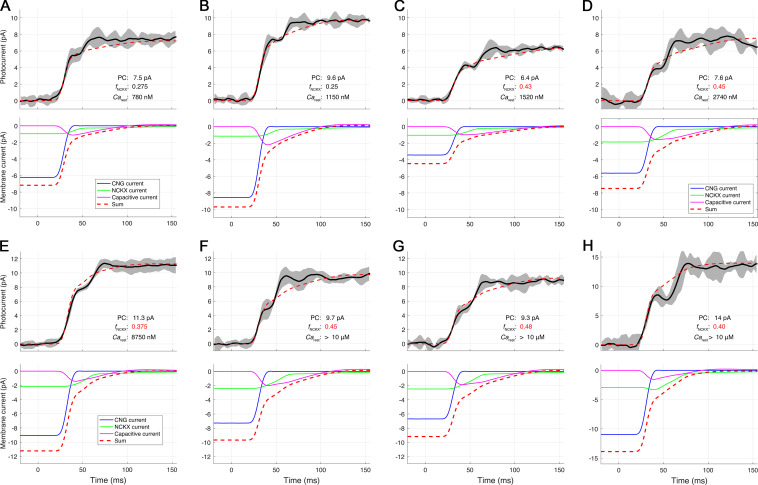
Figure S2.
Decomposition of the amplitude and rate-saturated photocurrents of Kv2.1−/− rods into three membrane current components: CNG, NCKX, and capacitive. Related to Fig. 7. The traces (heavy black line) are averages of several responses to flashes of at least three intense flash strengths up to 20,000 photons μm−2. The responses to different flash strengths were interpolated on a 100-µs grid and shifted for maximal congruence with the early rising phase (CNG channel closure) of the most intense flash. The running error (gray shaded region) is ±1 SD. A–H provide three numbers characterizing the theory traces: the saturated photocurrent (PC) amplitude; fNCKX, the fraction of the photocurrent ascribed to NCKX current; and Carest, the estimated Ca2+i in the dark-adapted rod immediately before the flash. The panels are arranged in order of increasing CaD, which ranges from approximately two times normal (A, 560 nM) to >4 µM (G); in the latter case, Carest greatly exceeds the internal binding constant Kex (1.1 µM) of the NCKX, which serves as a gauge (Fig. 7). The “average” value of Carest is 10-fold higher than the normal WT level. The values of fNCKX colored red exceed the naive theoretical limit of 0.33, which neglects the effect of hyperpolarization on the NCKX (the value of the half-saturation constant Kex of the NCKX current limits the reliability of estimating Carest, as it is highly nonlinearly dependent on fNCKX as the latter approaches its limit; thus, Carest estimates >4 µM were not differentiated). The preprocessing of the photocurrent data of each of the rods was performed with the procedure illustrated in Fig. S1.

