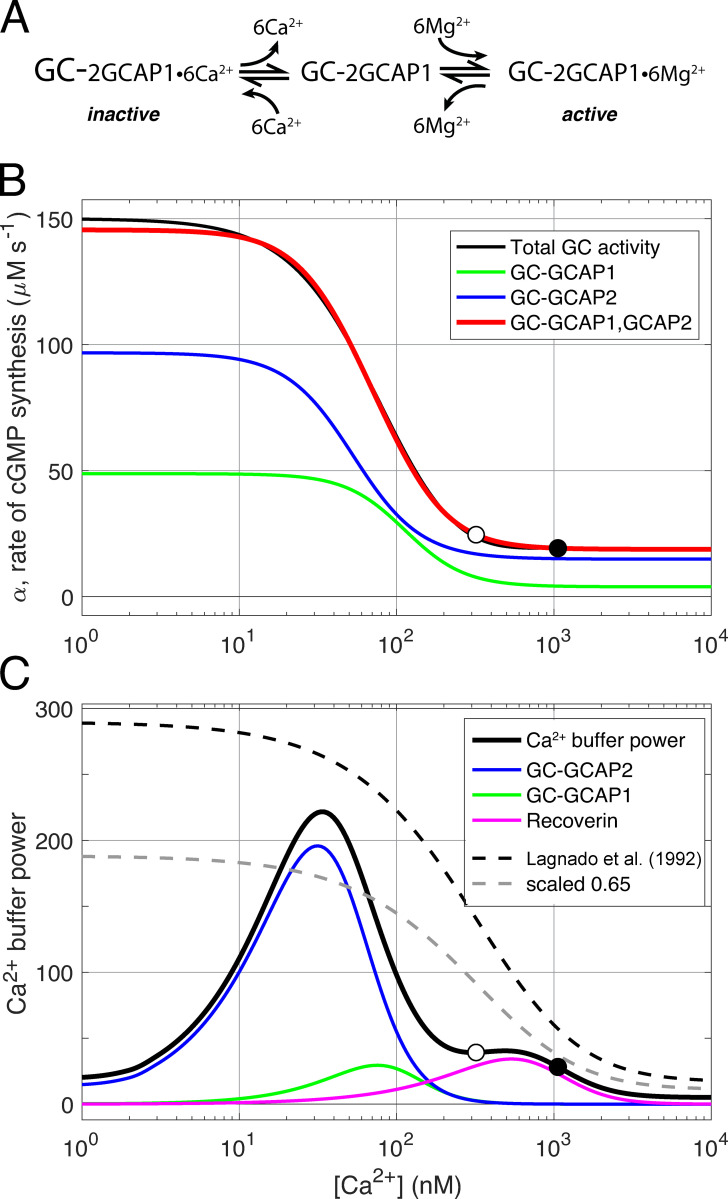
Figure S5.
Three-state guanylate cyclase (GC)–GCAPs model and Ca2+ buffering by GCAPs and recoverin. (A) Schematic of regulation of rod guanylate cyclase activity through Ca2+ and Mg2+ binding and unbinding to tightly associated GCAP1 protein (after Dizhoor et al., 2010). Each GC holomer is a dimer with three tightly associated guanylate cyclase type 1 activating proteins (GCAP1), and each GCAP1 has three functional EF hand calcium binding sites, for a total of six binding sites per GC. The calcium-bound GCAP1s inhibit the GC (inactive). When Ca2+i declines in the outer segment during the light response, Ca2+ dissociates from GCAP1 and is replaced by Mg2+, stimulating increased GC synthesis of cGMP. The schematic postulates the existence of a transient intermediate state in which the GCAPs are free of divalent cation. A parallel three-state scheme (not shown) is assumed to govern the interaction of GCAP2 with GC. (B) Decomposition of total steady state rod GC activity into a component regulated by GCAP1 and a second component regulated by GCAP2 (after Makino et al., 2008). The function defining total GC activity (black curve) is essentially that of Gross et al. (2012a), but manipulated for Ca2+i greater than the WT level (open circle at 320 nM) so that in a Kv2.1−/− rod at rest (filled circle), cGMP synthesis in the dark gives the appropriate level of CNG channel current (compare Fig. 8 B). The green and blue curves represent the activity of GC-GCAP2 and GC-GCAP1, respectively, and their summed activity is given by the red curve. The blue and green curves are determined Eq. S1 and Eq. S2 with parameters Kcyc,2 = 48 nM, ncyc,2 = 2.0, Kcyc,1 = 103 nM, and ncyc,1 = 2.3, respectively. The absolute scaling of the two curves was set by the least square fitting to the overall activity function (black curve), which saturates at 150 µM s−1; given a total GC concentration of 5 µM and the same turnover for each GC-GCAPj enzyme complex, the fitted concentrations of the two components are GC-GCAP1 = 1.77 µM and GC-GCAP2 = 3.23 µM. (C) Rod Ca2+ buffer power can be described in terms of Ca2+ binding by the EF hand proteins, GCAP1 and GCAP2, with three functional Ca2+ binding sites each; and recoverin, with two functional Ca2+ binding sites. Given the known stoichiometry of Ca2+ binding and the concentrations of GC (taken to be 5 µM referred to the outer segment cytoplasm) and recoverin (taken to be 25 µM), overall buffer power can be computed. The results of the calculation (thickened black curve) are compared with description of calcium buffering of salamander rods by Lagnado et al. (1992) (black dashed curve); also shown is the latter curve scaled by 65% (lighter dashed curve). The symbols plot the calculated Ca2+ buffer power at the resting Ca2+ levels of the WT (open circle) and Kv2.1−/− rod (filled circle; a buffer component with calcium-independent buffer power of 5 is not plotted; this component helps stabilize Ca2+i at nanomolar concentrations where the buffering power of GCAP2 declines).

