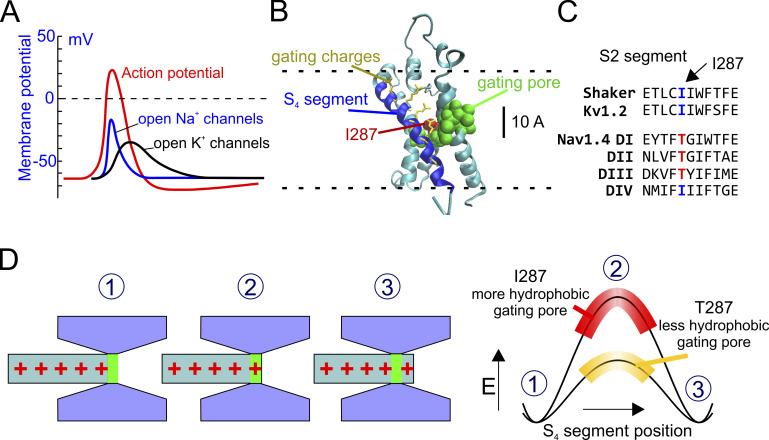
Figure 1.
A hypothesis for the kinetic differences between Kv and Nav channels. (A) Schematic plot showing the activity of NaV and KV channels during an action potential (red line). NaV channels open more rapidly than KV channels, creating the depolarizing phase of the action potential. (B) 3-D structure of the active state of the VSD of the Shaker channel (from Henrion et al., 2012). The S4 segment is in blue, and the S1–S3 segments are in cyan. The hydrophobic residues forming the gating pore (V236, I237, S240, I241, F244, C286, I287, F290, A319, and I320; Lacroix et al., 2014) are shown in van der Waals (VdW) representation (green). The residue 287 is colored in red. Gating charge side chains are shown in licorice representation and colored in yellow. (C) Portion of the S2 segments of several voltage sensors belonging to Shaker, KV, and fast NaV channels, showing the highly conserved isoleucine at position 287 in Shaker-like potassium channels and the threonine residue at the corresponding position in the fast NaV1.4 channel. (D) Schematic representation of the hypothesis tested in this paper. Left: The S4 voltage sensor is represented as a cylinder with the gating charges in red. The rest of the VSD is in gray and forms the gating pore and the intra- and extracellular vestibules. Right: Energetic profiles encountered by the first gating charge across the gating pore in the presence of two different hydrophobicity levels of the gating pore. When the gating charge enters the gating pore, there is an increase in the energy of the system due to the destabilizing (hydrophobic) environment within the gating pore. The more hydrophobic the gating pore, the higher the energy barrier and slower the activation rate.

