Figure 3.
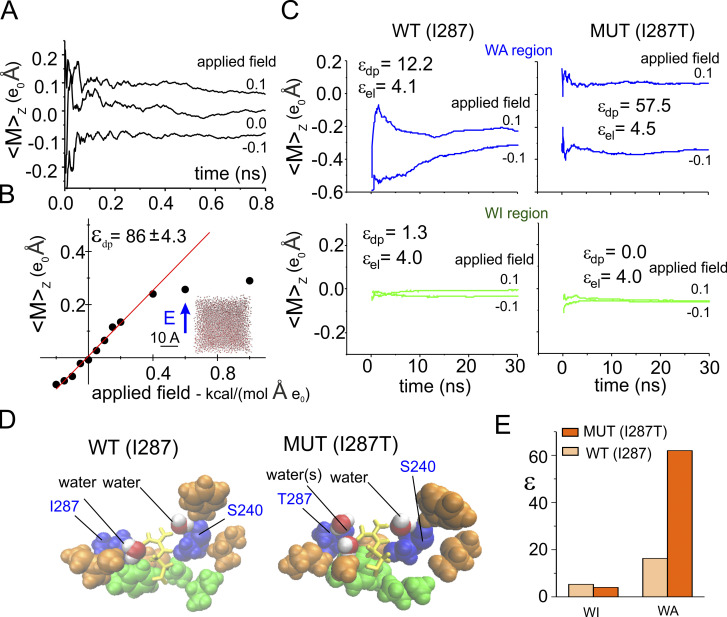
Estimation of the dielectric constant in the gating pore. (A) Running average of the dipole moment assessed for a water molecule inside a 30 Å cubic water box during three MD simulations performed under different applied electric fields along the z direction. (B) Plot of the mean total dipole moment of a water molecule as a function of the applied electric field. Each symbol represents the total dipole moment estimated for a water molecule taken at random during the last nanosecond of a 4-ns-long simulations performed in presence of variable applied fields (indicated). Data obtained at applied electric fields of ±0.2 kcal/(mol·Å·eo) were fitted with a straight line, and the dielectric constant reported in the plot was estimated from Eq. 7. Note that 1 kcal/(mol·Å·eo) corresponds to ∼0.4 V/nm. For comparison, a constant electric field of 0.2 kcal/(mol·Å·eo) would correspond to an electric potential difference of ∼240 mV across a phospholipid bilayer. (C) Plots of the mean total dipole moment at two different applied electric fields for the WA region (top) and WI region (bottom) of the gating pore, assessed from MD simulations using the WT (I287; left) of the mutated (MUT; I287T; right) structure of the VSD. From these data, the εpd was estimated and reported in each plot. The εel, also reported in the plot, was estimated from the Clausius–Mosotti relationship where α is the polarizability and Vol is the volume of the region considered, estimated from the molar polarizability of the amino acidic residues reported in Table 1 of Voges and Karshikoff (1998). The plots show running averages performed over the last 30-ns simulation, taken from a simulation in which the indicated electric field was applied for 100 ns to let the molecules to reorient. (D) 3-D structures of the gating pore in the WT and mutated VSD. The gating pore residues are shown in van der Waals (VdW) representation in green or orange/blue depending on their location in the WA or WI region of the gating pore, respectively. Residues 287 and 240, located very close to the gating charge, are colored in blue. Also shown (in VdW representation [red/white]) are the water molecules inside the WA region, within 3 Å of the charge on R371. The gating charge, R371, is shown in licorice representation (yellow). (E) Plot of the dielectric constant in the WA and WI regions of the gating pore, estimated as shown in C. MUT, mutated.

