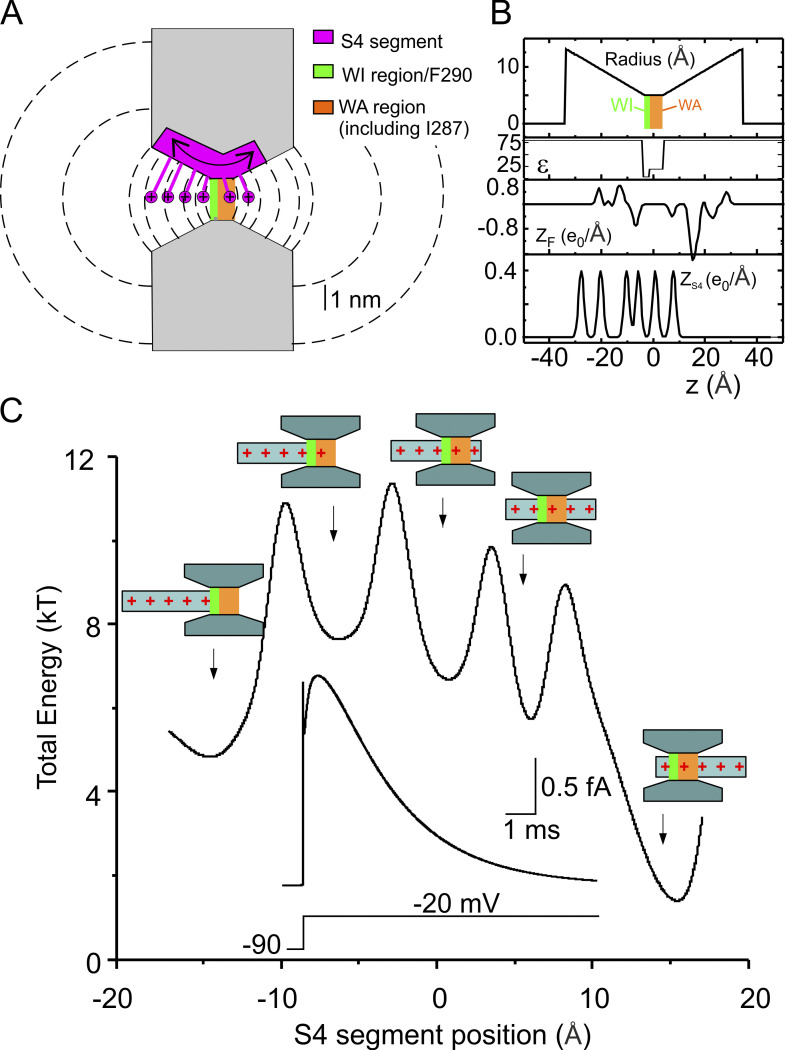
Figure 5.
The macroscopic model of voltage gating. (A) Schematic showing the geometry of the VSD assumed in our model. The S4 segment containing the gating charges was assumed to move perpendicular to the membrane through the gating pore (7 Å long) and the extracellular and intracellular vestibules (each 31.5 Å long, and opening with a half angle of 15°). Note that compared with the model presented in Catacuzzeno and Franciolini (2019), the gating pore is 5 Å longer to accommodate several hydrophobic residues, including residue I287. The vestibules are correspondingly shorter to give the same overall length. The dashed lines represent some of the surfaces delimiting the volume elements considered in our numerical simulations (see Catacuzzeno and Franciolini, 2019 for details). (B) Profile of the gating pore radius illustrating the 2-Å region, comprising F290 and assumed to be fully impermeant to water (WI, green bar), and the WA 5-Å region comprising I287 (WA, red bar), the effective dielectric constant (ε), the fixed charge density located in the S1–S3 region of the VSD (ZF), and the charge density on the S4 segment (ZS4), for the Shaker model structure. x = 0 was placed in the center of the gating pore. (C) Plot showing the total energy associated to the S4 segment, assessed as as a function of the S4 segment position. The electrostatic energy profile displays five clear energy wells associated with five different positions of the voltage sensor (represented in schematic form). Inset: Simulated macroscopic gating current evoked by a voltage pulse from −90 to −20 mV, using our Brownian model of the voltage sensor. Note that the energy used here does not include entropic effects or frictional losses.

