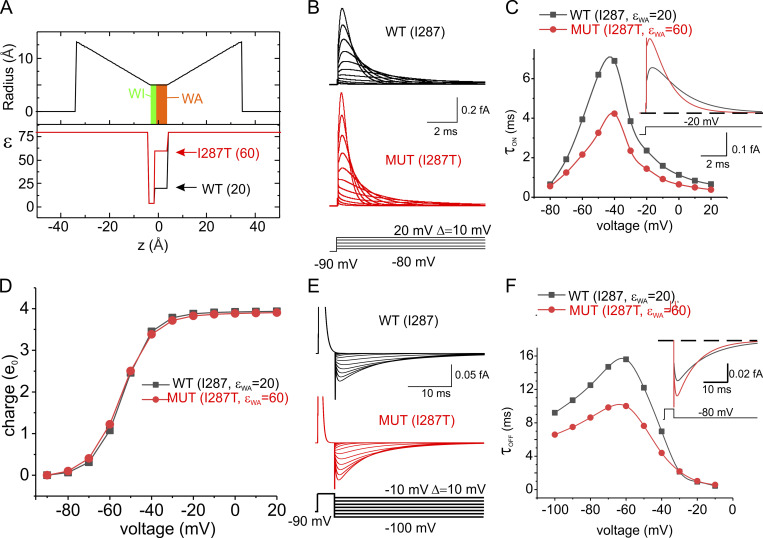
Figure 6.
Prediction of the effect of the I287T mutation on the kinetics of gating currents. (A) Profile of the gating pore radius and the effective dielectric constant along the VSD of the WT and the I287T mutated models of voltage gating. The two models only differ in the dielectric constant in the WA region of the gating pore. (B) Simulated gating currents obtained in response to depolarizing pulses from a holding potential of −90 mV for both the WT (black) and the mutated (red) models. (C) Plot of the decay time constant of the ON gating currents shown in B as a function of voltage. When the gating current decay was clearly biexponential, a mean of the two time constants weighted for the respective areas was reported. Inset: Superimposed ON gating currents obtained in response to a depolarization to −20 mV for the two models. (D) Plot of the mean charge versus the applied voltage, obtained by integrating the ON gating currents over 40-ms-long simulations at different applied voltages. No appreciable difference was observed in the two models. (E) Simulated gating currents obtained in response to repolarizing pulses after a short (4 ms) depolarizing step to 20 mV for the WT (black) and the mutated (red) models. (F) Plot of the decay time constant of the OFF gating currents shown in E as a function of voltage. Inset: Superimposed OFF gating currents obtained in response to a repolarization to −80 mV for the two models. MUT, mutated.

