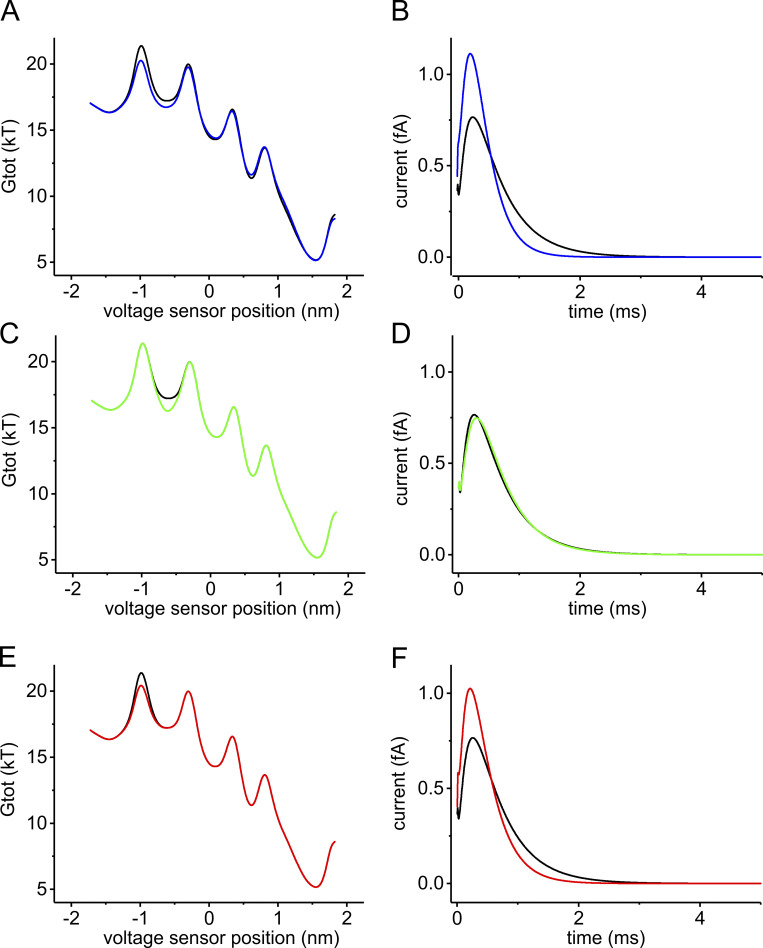
Figure 8.
Contribution of the changes in the energy peak and well to the kinetic change of gating currents. (A) Total energy profiles (Gtot) of the voltage sensor assessed at +30 mV of applied potential using our Brownian model, with a relative dielectric constant of the WA region of the gating pore set to either 20 (black) or 60 (blue), in order to predict the effect of the I287T mutation. (B) Macroscopic gating currents predicted for the energy profiles in A using the Fokker–Planck equation. The initial condition of the simulation is a probability density function placing all voltage sensors at the first well of the energy profile (xS4 = −1.425 nm). (C–F) Starting from the WT model, the energy profile was manually altered to selectively lower the second well (brown trace in C) or the first barrier (green trace in E). The effects of these changes on the time course of the macroscopic gating currents, predicted using the Fokker–Planck equation, are shown in D and F, respectively.

