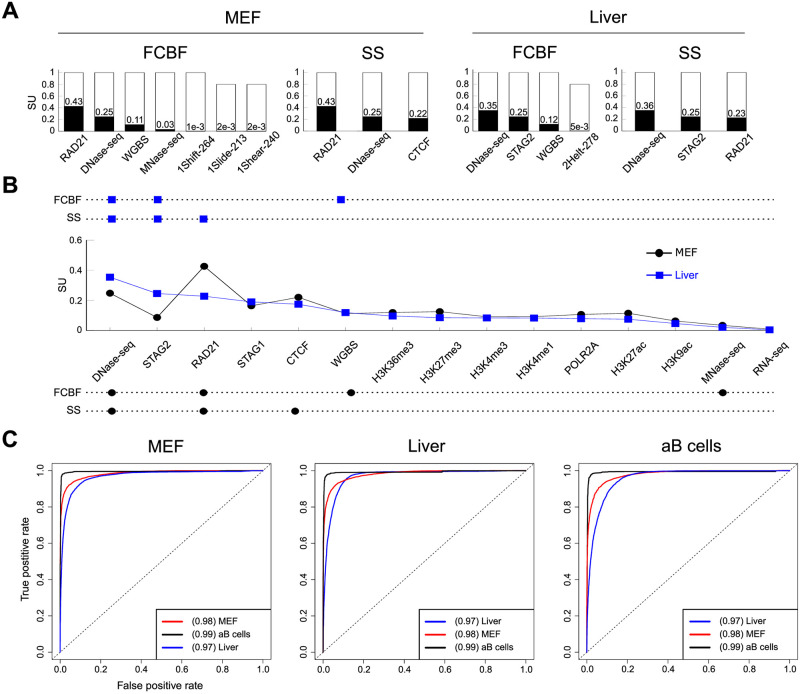
Fig 4. Three features accurately predict TOP2B.
A. Top features selected by Fast Correlation Based Filter and Scatter Search algorithms. For each histogram and feature, the white bar height indicates the frequency of selection and the black bar height is the Symmetrical Uncertainty (SU) value with respect to the class (TOP2B). Indexes of DNA shape parameters indicate position within the corresponding parameter vector associated to the 300 bp width of modeled TOP2B binding sites (see Materials and methods). B. Summary of the most selected features by both algorithms. Top and bottom aligned dots indicate selection of a given feature by the corresponding selection algorithm in liver and MEFs, respectively. In the middle, the SU of each feature is displayed. Only the top fifteen features according to their SU are shown, which happen to match in both systems. C. ROC curves and AUC values for Naive Bayes models trained on either MEF, liver or activated B cells and applied to the three systems (for Support Vector Machine and Random Forests models, see S4 Fig). Only DNase-seq, RAD21 and CTCF binding data were used for training.

