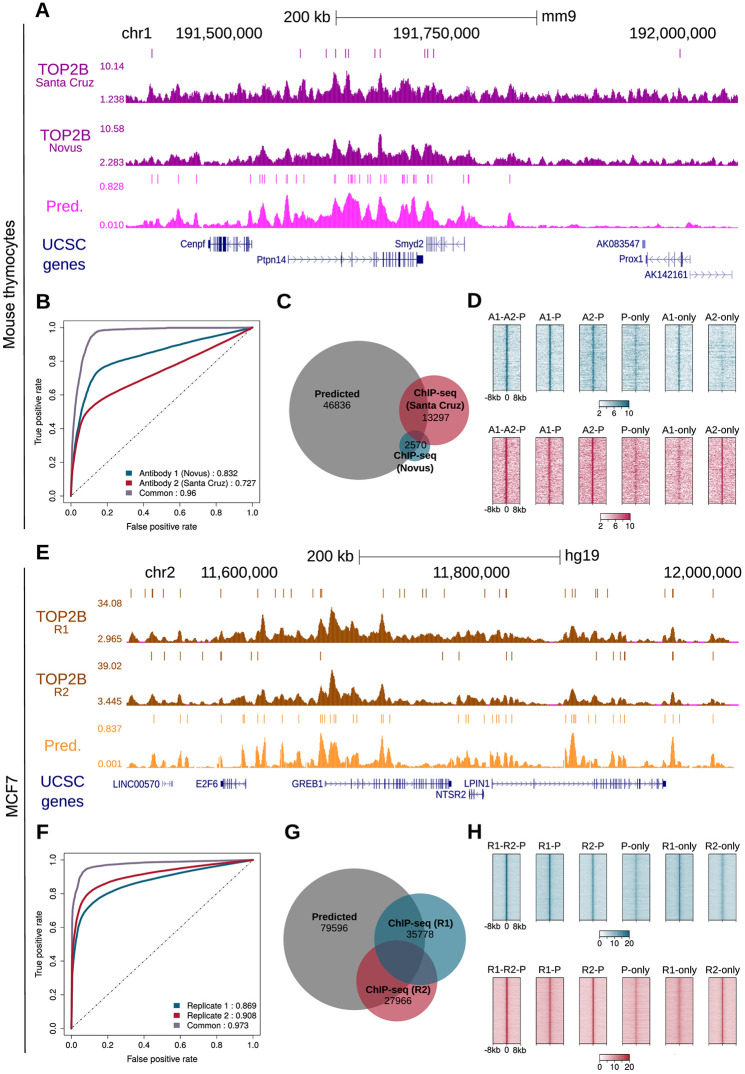
Fig 6. Validation of TOP2B model in mouse thymocytes and human MCF7.
A. TOP2B predictive and ChIP-seq tracks of mouse thymocytes in a selected region of the mouse genome. Identified peaks are displayed above the signals. B. ROC curves and AUC values for the prediction of TOP2B peaks detected using Novus and Santa Cruz antibodies. C. Venn diagram showing the overlaps between predicted TOP2B peaks and the two sets of experimental peaks. D. Heatmap representations of TOP2B ChIP-seq reads enrichment within ± 8 kb of several set of peaks: predicted and confirmed by HOMER calls of both antibodies (A1-A2-P), predicted and confirmed only by Novus antibody (A1-P) or Santa Cruz (A2-P), only predicted (P-only), only detected by Novus (A1-only) and only detected by Santa Cruz (A2-only). For illustration purposes, the same number of randomly selected peaks is represented in all the heatmaps. E. TOP2B predictive and ChIP-seq tracks of MCF7 in a selected region of the human genome. Identified peaks are displayed above the signals. F. ROC curves and AUC values for the prediction of TOP2B peaks in two replicates performed in MCF7. G. Venn diagram showing the overlaps between predicted TOP2B peaks and the two sets of experimental peaks. F. Heatmap representations of TOP2B ChIP-seq reads enrichment within ± 8 kb of several set of peaks: predicted and confirmed by HOMER calls of both replicates (R1-R2-P), predicted and confirmed only by the first (R1-P) or the second replicate (R2-P), only predicted (P-only), only detected by the first replicate (R1-only) and only detected by the second replicate (R2-only). As in D, the same number of randomly selected peaks is represented in all the heatmaps.

