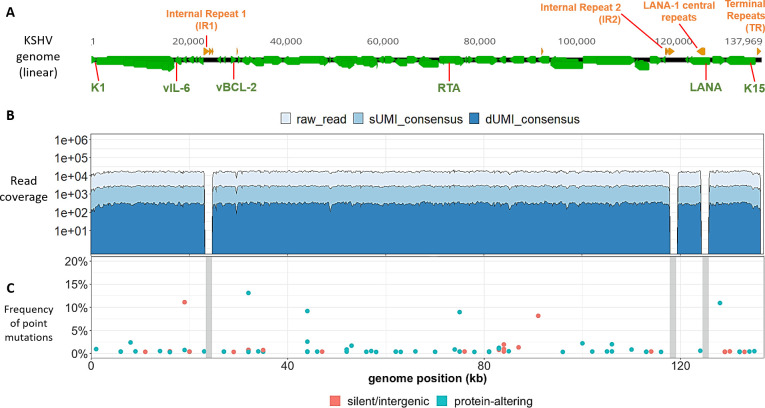
Fig 1. KSHV genomes in BCBL-1 cells have low point mutational diversity.
(A) Schematic representation of a linear KSHV genome, with genes colored in green and the major repeat regions in orange. The locations of the K1, vIL-6, vBCL-2, RTA, LANA and K15 genes used for genome quantitation are indicated in green type. (B) Raw (light blue), sUMI-consensus (blue) and dUMI-consensus (dark blue) read coverage along the de novo assembled, BCBL-1 KSHV genome. (C) Bubble plot of minor sequence variants. Each bubble represents a position within the genome at which a variant base or indel was detected, colored by whether they were predicted to be silent or protein-altering mutations. Mutations likely to be silent included synonymous and intergenic point mutations, while protein-altering mutations included non-synonymous, nonsense and frameshift mutations. Bubble height represents variant base frequency among dUMI-consensus reads at that position. Vertical grey columns represent masked repeat regions in which no reliable alignments were possible.

