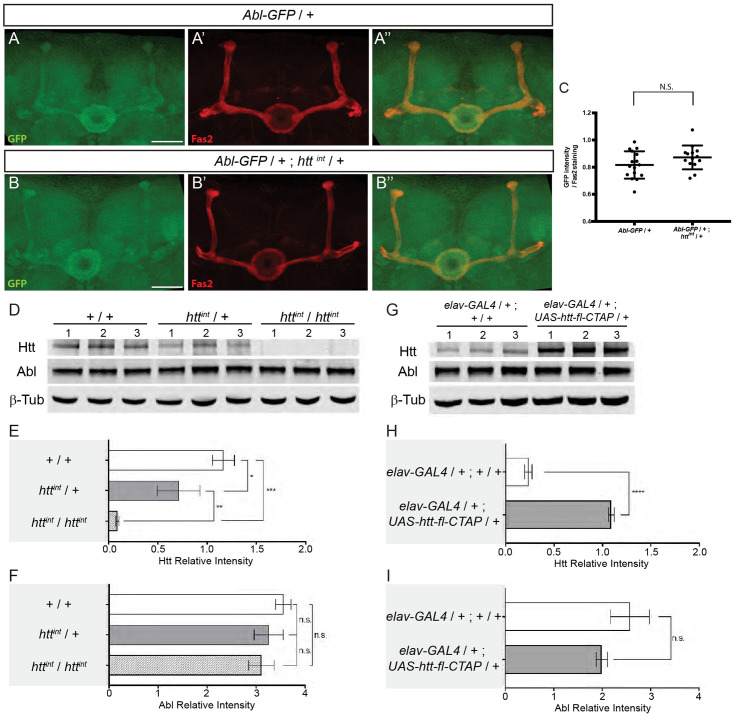
Fig 6. htt does not seem to affect the quantity of ABL in the MBs or the total levels of neuronal Abl in Drosophila.
(A-B”) Expression of the Abl-GFP genomic transgene in a WT (A) and in a httint heterozygous mutant background (B) at 48 hAPF. Anti-Fas2 staining marked αβ neurons (A’-B’). Merge of GFP and anti-Fas2 staining (A”-B”). Note that panels A-A” are also presented in Fig 3J–3J”. (C) Quantitation of the GFP expression within MBs is not significantly different (N.S.) between WT and httint heterozygous mutant background using a Mann-Whitney U test. The scale bar indicates 30 μm. Details of image quantification procedure and full genotypes are: (C) After having outlined the MB with the Fas2 staining, GFP and Fas2 intensities from MB shape were quantified for each slices of the stack. The GFP intensity of each slices was averaged and then normalized by the mean Fas2 intensity. Number of MB analyzed: control = 16, htt mutant = 14. Quantitation of the GFP expression within MBs is not significantly different between WT and httint heterozygous mutant background using a Mann-Whitney U test. Quantitation were done with ImaJ software. Images are composite stacks to allow the visualization of axon trajectories along their entire length. Genotypes: (A) y w67c23; Abl-GFP / +. (B) y w67c23; Abl-GFP / +; httint / +. (D) Western blots of whole cell lysates from adult heads from the following genotypes: +/+, httint/+ and httint/httint. Levels of Htt, Abl, and β-Tubulin (β-Tub) were assessed by probing blots using the indicated antibodies. 1, 2, and 3 indicate biological replicates for each line. (E and F) Quantitation of Htt (E) or Abl (F) protein levels in the indicated genotypes was assessed from western blots in (D) relative to β-Tubulin and plotted as relative band intensity. (G) Htt was over-expressed using elav c155-GAL4 > UAS-htt-fl-CTAP. Lysates from adult heads were subjected to western blotting to assess Htt, Abl, and β-Tubulin levels. 1, 2, and 3 indicate biological replicates for each line. (H and I) Quantitation of Htt (H) or Abl (I) protein levels in the indicated genotypes was assessed from western blots in (G) relative to β-Tubulin and plotted as relative band intensity. In E and F, significance was calculated by one-way ANOVA. In H and I, significance was calculated by unpaired t-test. In E, F, H and I, errors indicate standard deviation. (n.s. not statistically different, *P<0.05, ** P<0.01, *** P<0.001,**** P<0.0001).

