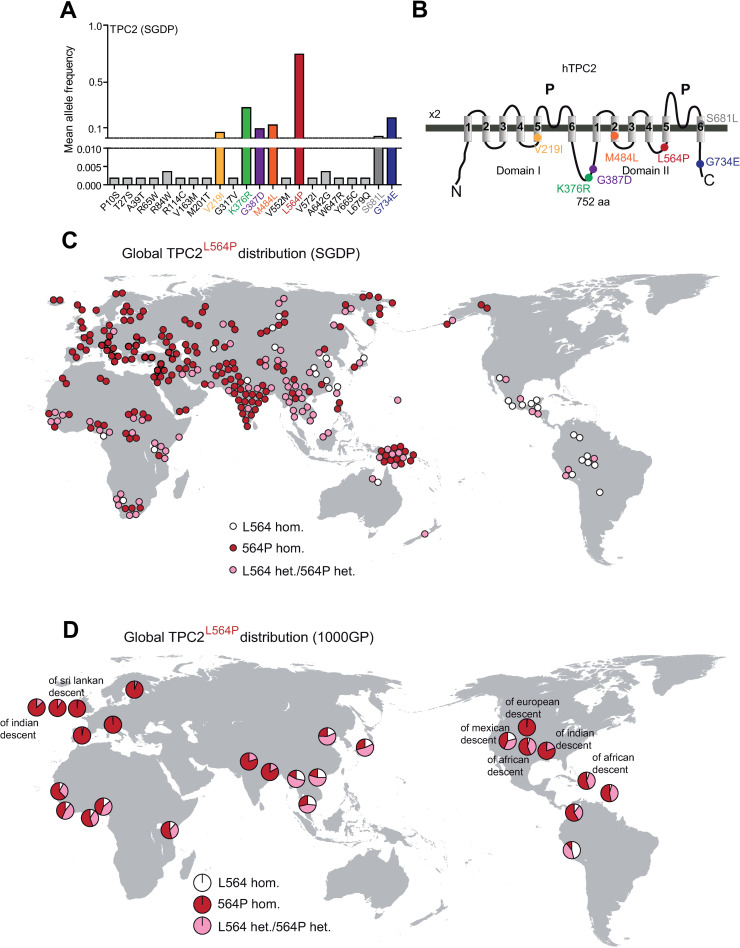
Fig 1. Analysis of the sequencing data derived from the SGDP data set and the 1000GP data set.
(A) Mean allele frequency in the Simons Genome Diversity Project (SGDP) data set of all homozygous (colored) and heterozygous SNPs in the TPC2 gene leading to a missense mutation. (B) Cartoon showing the estimated positions of the polymorphisms in the human TPC2 protein. (C) Map of the worldwide distribution of TPC2L564P in the SGDP data set. Each circle represents one individual from an indigenous population, respectively. White circles represent individuals homozygous for TPC2P564L, red circles represent individuals homozygous for TPC2L564P, and pink circles represent heterozygous individuals. (D) Map of the worldwide distribution of TPC2L564P in the 1000GP data set. Each circle represents one of the 26 populations (indigenous or non-indigenous (other descent) as indicated). Color coding scheme corresponds to the one in (C).

