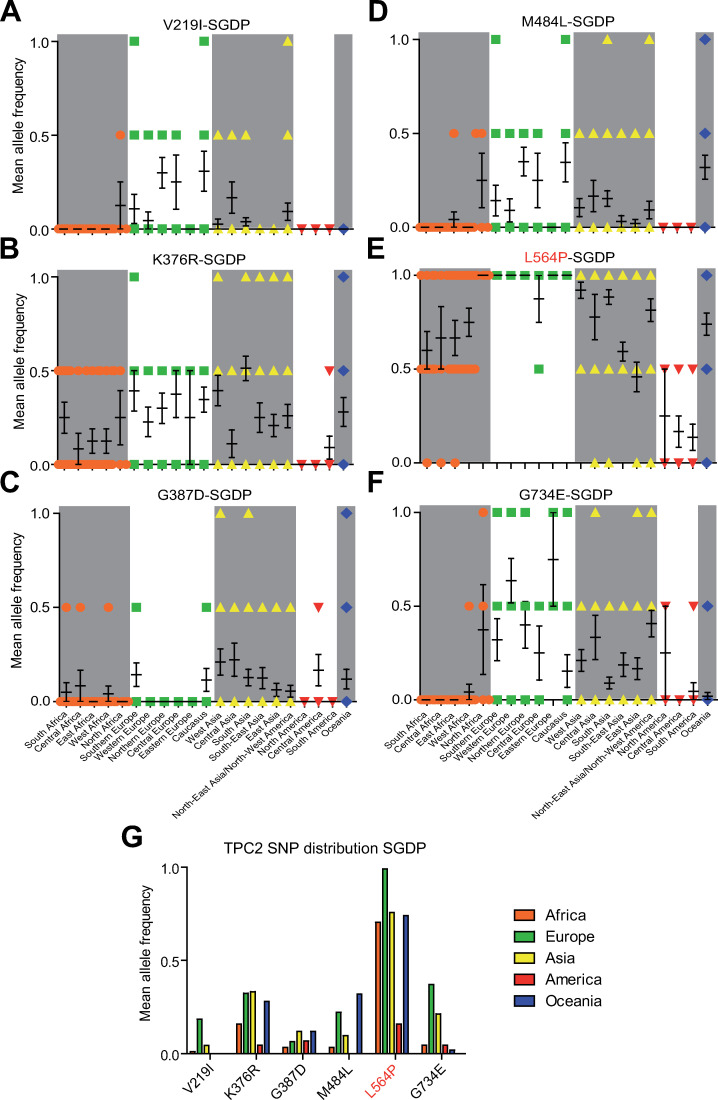
Fig 2. Geographical distribution of all homozygous TPC2 SNPs found in the SGDP data set.
The 297 samples were grouped according to their geographic origin. (A-F) Mean allele frequency of each SNP (mean ± SEM) grouped by geographic region, each symbol (circle, square, triangle) represents one sample (G) Mean allele frequency of each SNP grouped by continent.

