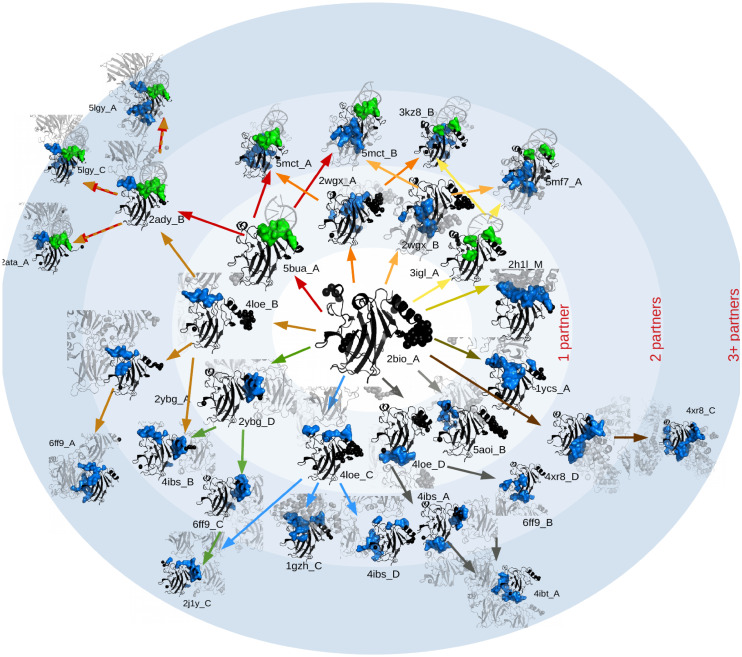
Fig 2. Hierarchical organisation of interfaces.
We show different structures (PDB ID shown) containing the core domain of the p53 protein (in black) interacting with other partners (in pale grey). Missing residues are modelled as black spheres in the vicinity of their nearest ordered neighbours in the sequence. The interaction interface (on the protein) is displayed in blue if the partner is a protein, and in green, if it is DNA. Structures are ordered laying in concentric circles marking the number of direct partners (within 5Å) of the p53 protein. Cluster labelled as “4ibs_A” contains 196 PDB entries, among which we measured 41 different interfaces (definition later in Materials and Methods—clustering procedure). The graph is generated automatically by comparing the different interfaces. We included here only 32 of them (the PDB ID of each structure is written just next to the structure). For the rest, some were left aside for space reasons (represented here by the radial lines), and the rest because they were qualitatively very similar to the interfaces displayed in the figure. The different interfaces can be placed in a hierarchical graph where each new oriented branch (arrow) represents adding one or more new interfaces to the one shown in the previous structure. Please note that this is just a way of ordering the complexity of the interfaces of the cluster, not a temporal representation of the order of assembly of complexes. A larger version of this figure and additional examples of hierarchies are given in S1 and S2 Figs.

