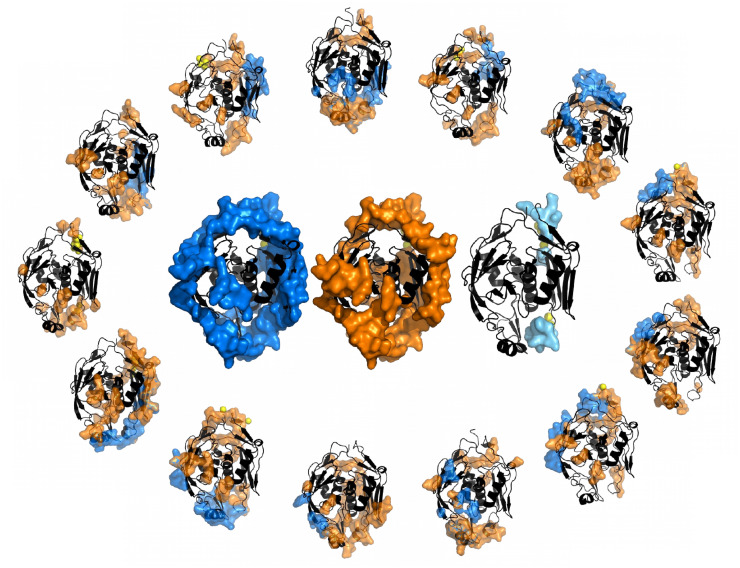
Fig 4. Example of a cluster of a protein’s structures.
Analysis of the cluster 6c9c_A (PDB IDs for the structures are given in S1 Text, Section D). In the external wheel, we show one unbound structure and the chain structures containing the 12 different interfaces of this cluster: SDRs in orange and IRs in blue. Missing residues are modelled as yellow spheres and localised close to those AA in the structure that are direct neighbours in the sequence. In the centre, UIR (blue), USDR (orange) and DtO (lightblue) are mapped on the structure of the cluster’s representative. We show an analogous figure including the partners, the b-factor and the binding sites in S4 Fig.

