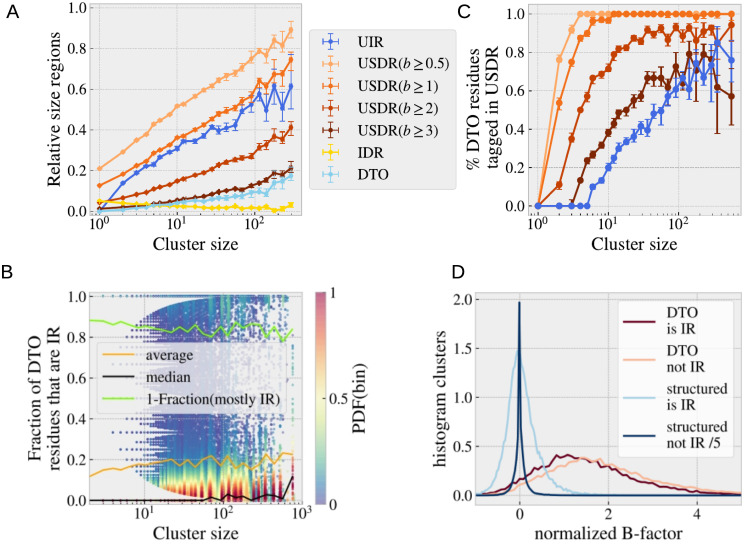
Fig 6. Statistics of the disorder-to-order regions.
A. We show the relative size (with respect to the sequence length) of the union of the interface regions (UIR, blue), soft disordered regions (USDR, different shades of orange that correspond to different thresholds for the b-factor), the intrinsic disordered regions (IDR, yellow) and the disorder-to-order (DtO, light-blue) regions, as function of the cluster size (averaged using the bins of Fig 5). In B., we show the fraction of the structures in each cluster where the DtO residues belong to the interface, among the total of structures where it is not missing. We show the median and the average of these values using bins of similar cluster size. The large majority of the DtO residues are not part of an interface. We show in light green 1 minus the fraction of these residues that are part of an interface in more than half of the structures of the cluster. In C. we show the fraction of the DtO residues that are contained in the rest of the unions of regions in A. In D. we show a histogram of the mean value of the b-factor in each cluster for structured (never missing) residues and DtO residues, that are (or not) part of the interface region (IR).

