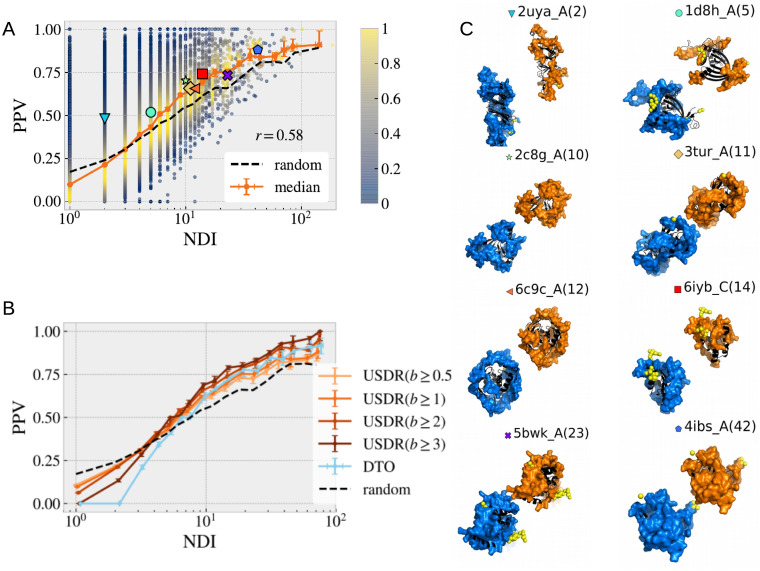
Fig 8. Correspondence between the location of USDRs and UIRs.
We compare the sequence location of the USDRs with the location of the UIRs. In A., we show the probability that a USDR (defined as b ≥ 1) residue is also included in the UIR for all the clusters in our database (dots). The dot colour marks the density of points in the PPV region in eac h bin. In orange error-bars we show the median among clusters obtained in each bin. The dashed black lines shows the median among the same clusters of the ‘no correspondence’ expectation. In B., we show the PPV medians by bin obtained using different definitions for the USDR (in different shades of orange) and using the DtO residues (in light blue). In C. we show several snapshots of the protein structure of 8 clusters where the UIR and USDR in the cluster is shown as blue and orange surfaces, respectively. The PDB ID of the cluster representative and the cluster’s NDI are shown on the top, together with a big-colour point that allows us locate the PPV metrics of A.

