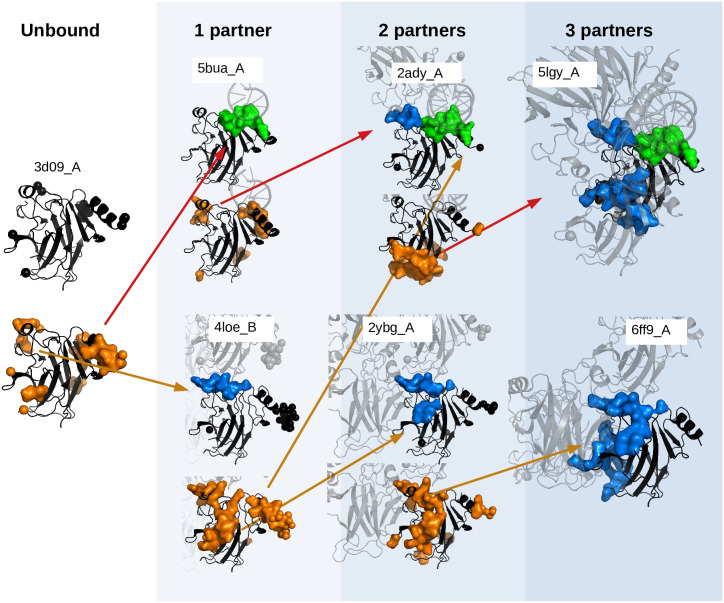
Fig 11. Progressive change of the disorder.
In A, we show the SDRs (orange) of all the unbound structures of the cluster 4ibs_A (the core domain of protein p53) at the sides of the figure, together with the union of all of them in the large structure in the centre. In addition, we include several structures (in black) containing 10 different interfaces with a single direct interaction partner shown in Fig 2 (partners’ structure in pale grey) in the external wheel (interfaces with proteins in blue and with DNA in green), showing that interfaces occur in regions that were characterised as disordered in the unbound structures. In B, we show the progressive change of the SDRs upon binding along the red and orange branches of the tree in Fig 2. For instance, the SDR of one of the unbound structures in the PDB allows us to predict the interfaces of this protein with other partners (DNA in PDB ID 5bua_A and another p53 protein in PDB ID 4loe_B). Again, the SDRs measured at these complexes show the location of the new interfaces with a second partner (PDB IDs. 2ady_A and 2ybg_A). This situation is also observed when a third partner is considered (PDB IDs. 5lgy_A and 6ff9_A). The background colours refer to the different concentric circles in Fig 2.

