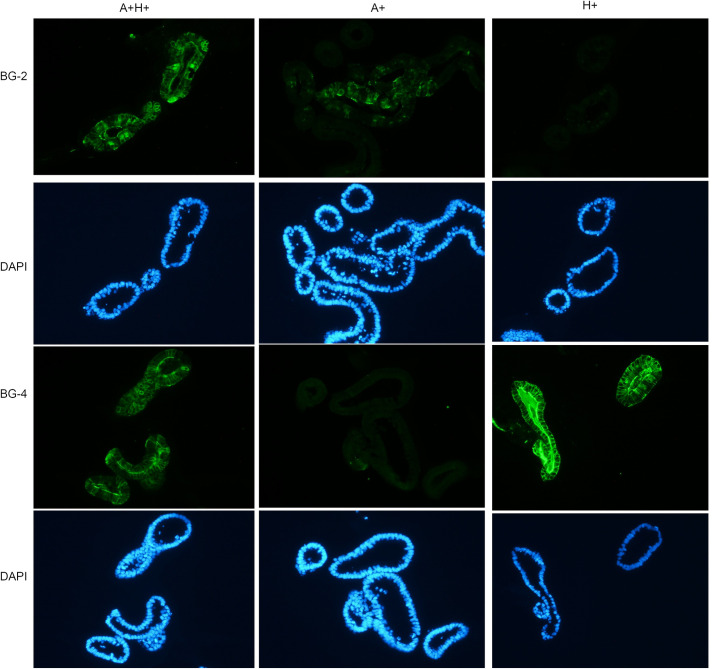
Fig 3. HBGA phenotyping by immunofluorescence antibody.
The first row is mouse mAb BG-2 (anti-A antibody) followed by Alexa Fluor 488 Goat anti-mouse IgG3 (1:1000, Thermo Fisher Scientific) stained green. The second row is the corresponding DAPI staining (blue) for the first row. The third row is mouse mAb BG-4 (anti-H antibody) followed by Alexa Fluor 488 Goat anti-mouse IgG3 (1:1000, Thermo Fisher Scientific) stained green and the fourth row is the corresponding DAPI staining for the third row. Thus, the left, middle, and right column represent A+H+, A+, and H+ PIEs, respectively.

